Open Access
Fig. B.1
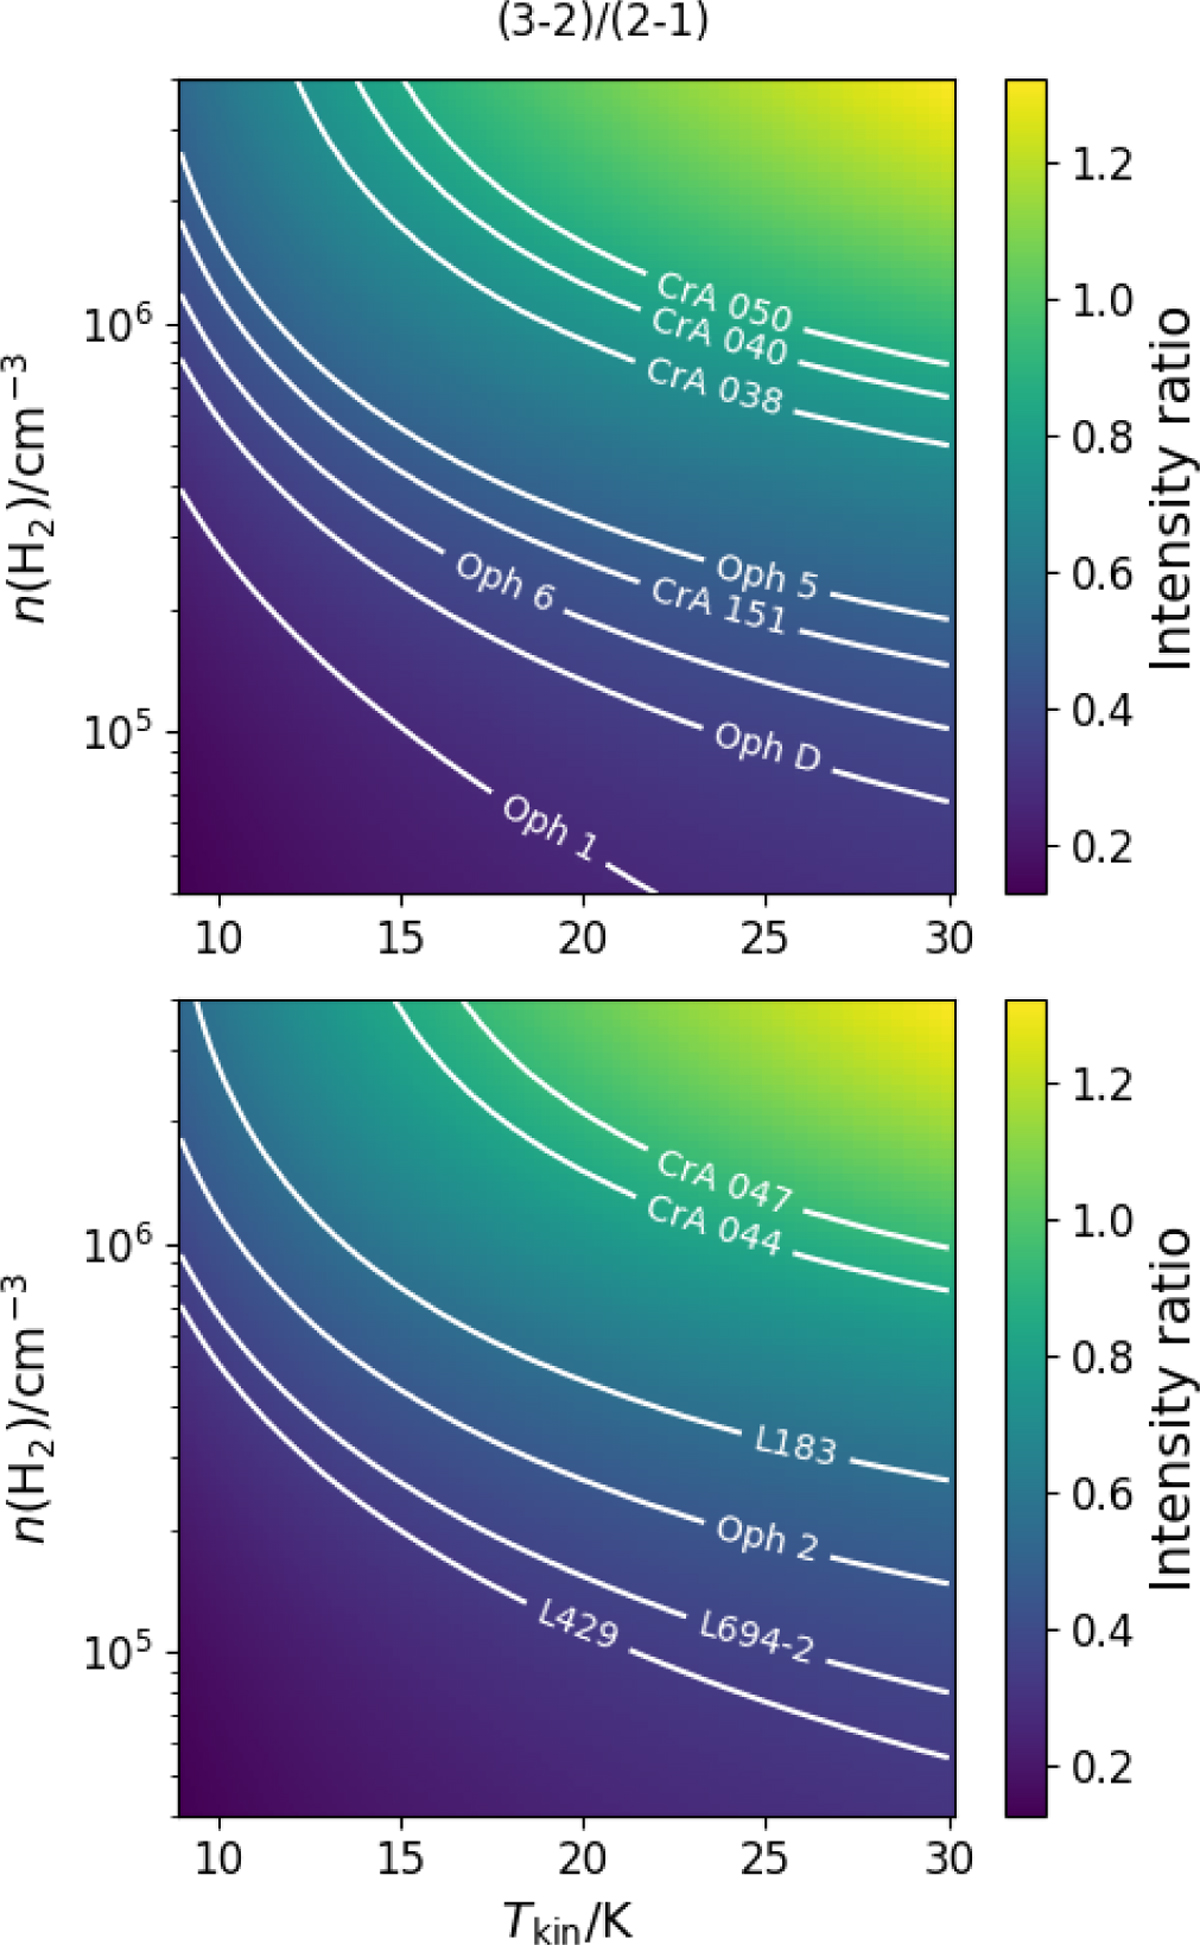
Download original image
H13CO+ line intensity ratio (3−2)/(2−1) as a function of H2 volume density versus gas kinetic temperature (Tkin). The plot has been obtained with RADEX, assuming the average H13CO+ column density measured in the sample (9.4 × 1011 cm2). The curves, labelled by object, show the observed values.
Current usage metrics show cumulative count of Article Views (full-text article views including HTML views, PDF and ePub downloads, according to the available data) and Abstracts Views on Vision4Press platform.
Data correspond to usage on the plateform after 2015. The current usage metrics is available 48-96 hours after online publication and is updated daily on week days.
Initial download of the metrics may take a while.