Open Access
Fig. B.2
Download original image
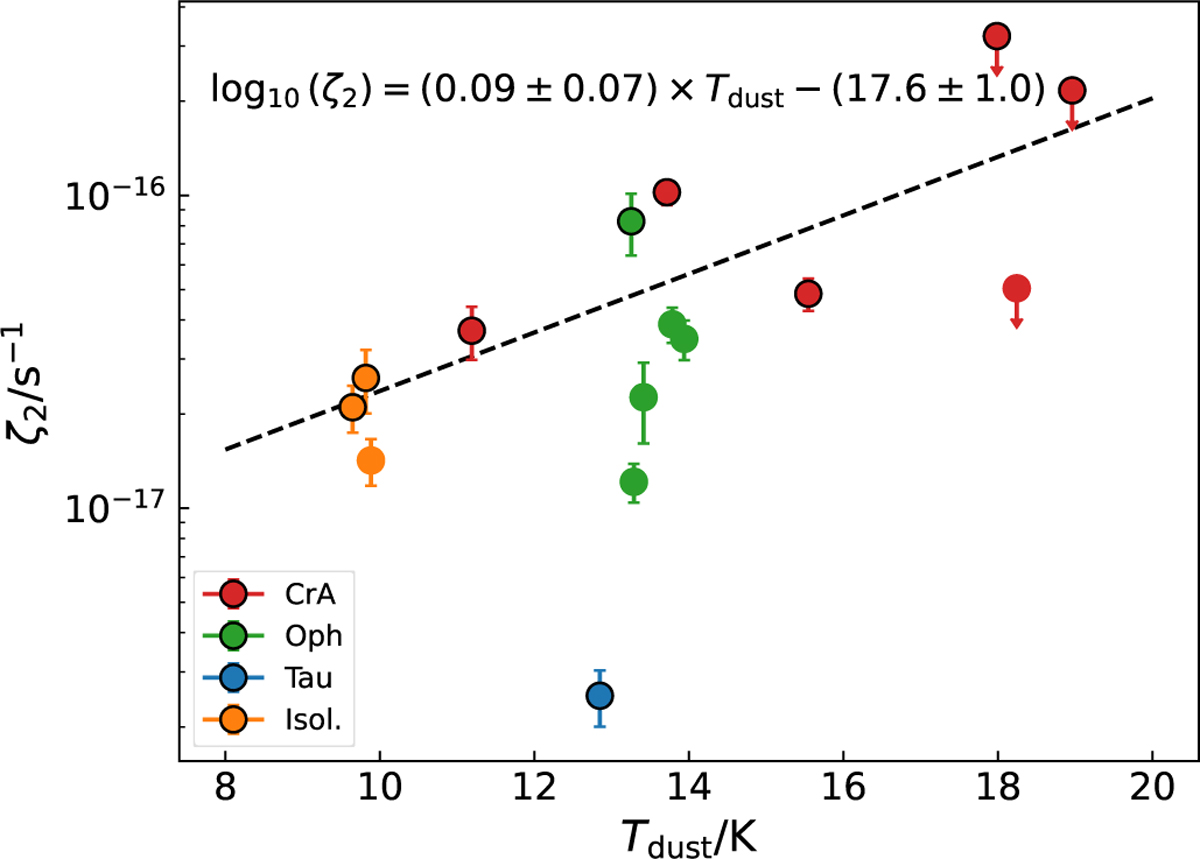
Plot of ζ2 as a function of Tdust, where the n(H2) values have been re-evaluated from the H13CO+ line emission, as explained in the Text. The sources where we increased n(H2)cont in the LVG calculations are shown with black edges. The dashed black curve shows the linear best fit to the data, in log-linear space.
Current usage metrics show cumulative count of Article Views (full-text article views including HTML views, PDF and ePub downloads, according to the available data) and Abstracts Views on Vision4Press platform.
Data correspond to usage on the plateform after 2015. The current usage metrics is available 48-96 hours after online publication and is updated daily on week days.
Initial download of the metrics may take a while.