Fig. 5
Download original image
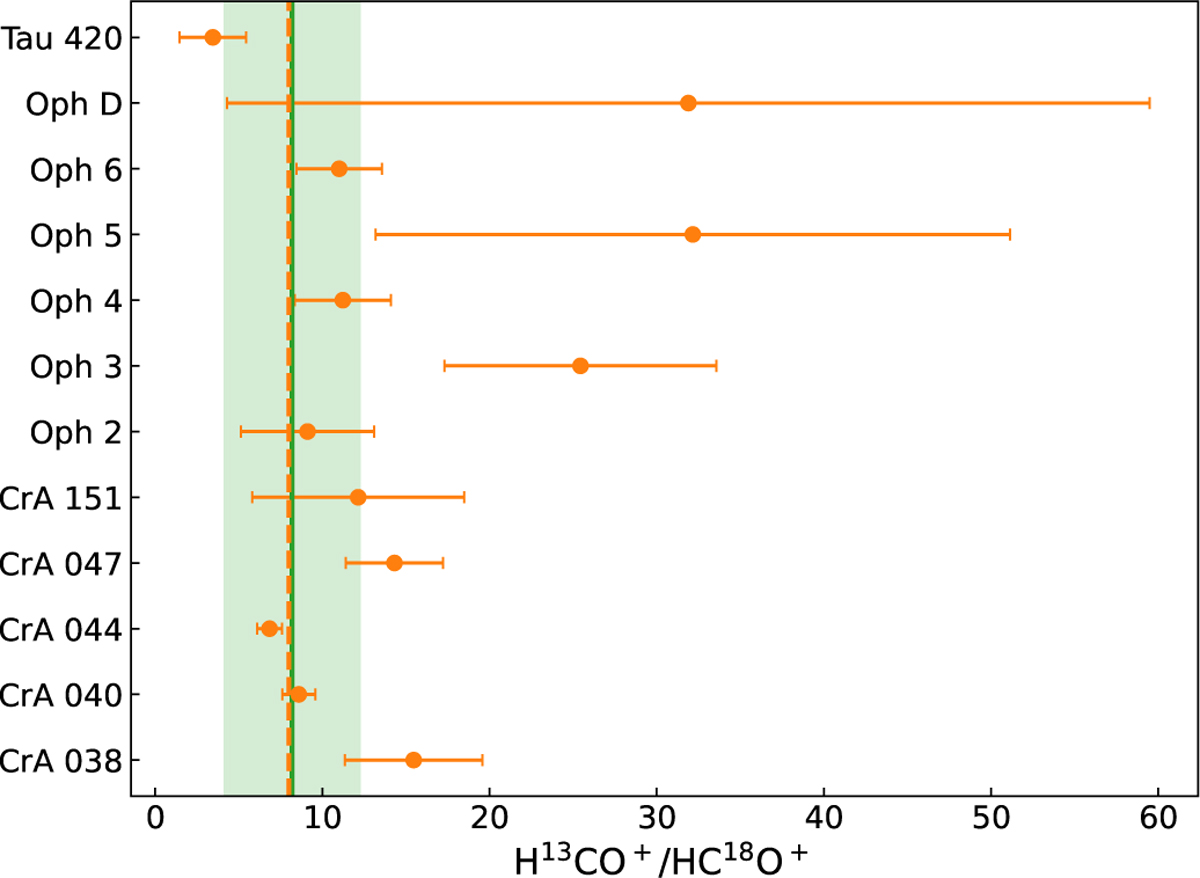
Orange points show measured flux ratio between the H13CO+ and HC18O+ (2−1) lines, in those cores where both transitions are detected (labelled on the y-axis). Error bars show the 3σ level. The vertical dashed orange line shows the weighted average of the sample. The expected value of 557/68 = 8.2 is shown with the vertical green line, and the shaded green area shows a variation of a factor of 2 around it.
Current usage metrics show cumulative count of Article Views (full-text article views including HTML views, PDF and ePub downloads, according to the available data) and Abstracts Views on Vision4Press platform.
Data correspond to usage on the plateform after 2015. The current usage metrics is available 48-96 hours after online publication and is updated daily on week days.
Initial download of the metrics may take a while.