Fig. 7
Download original image
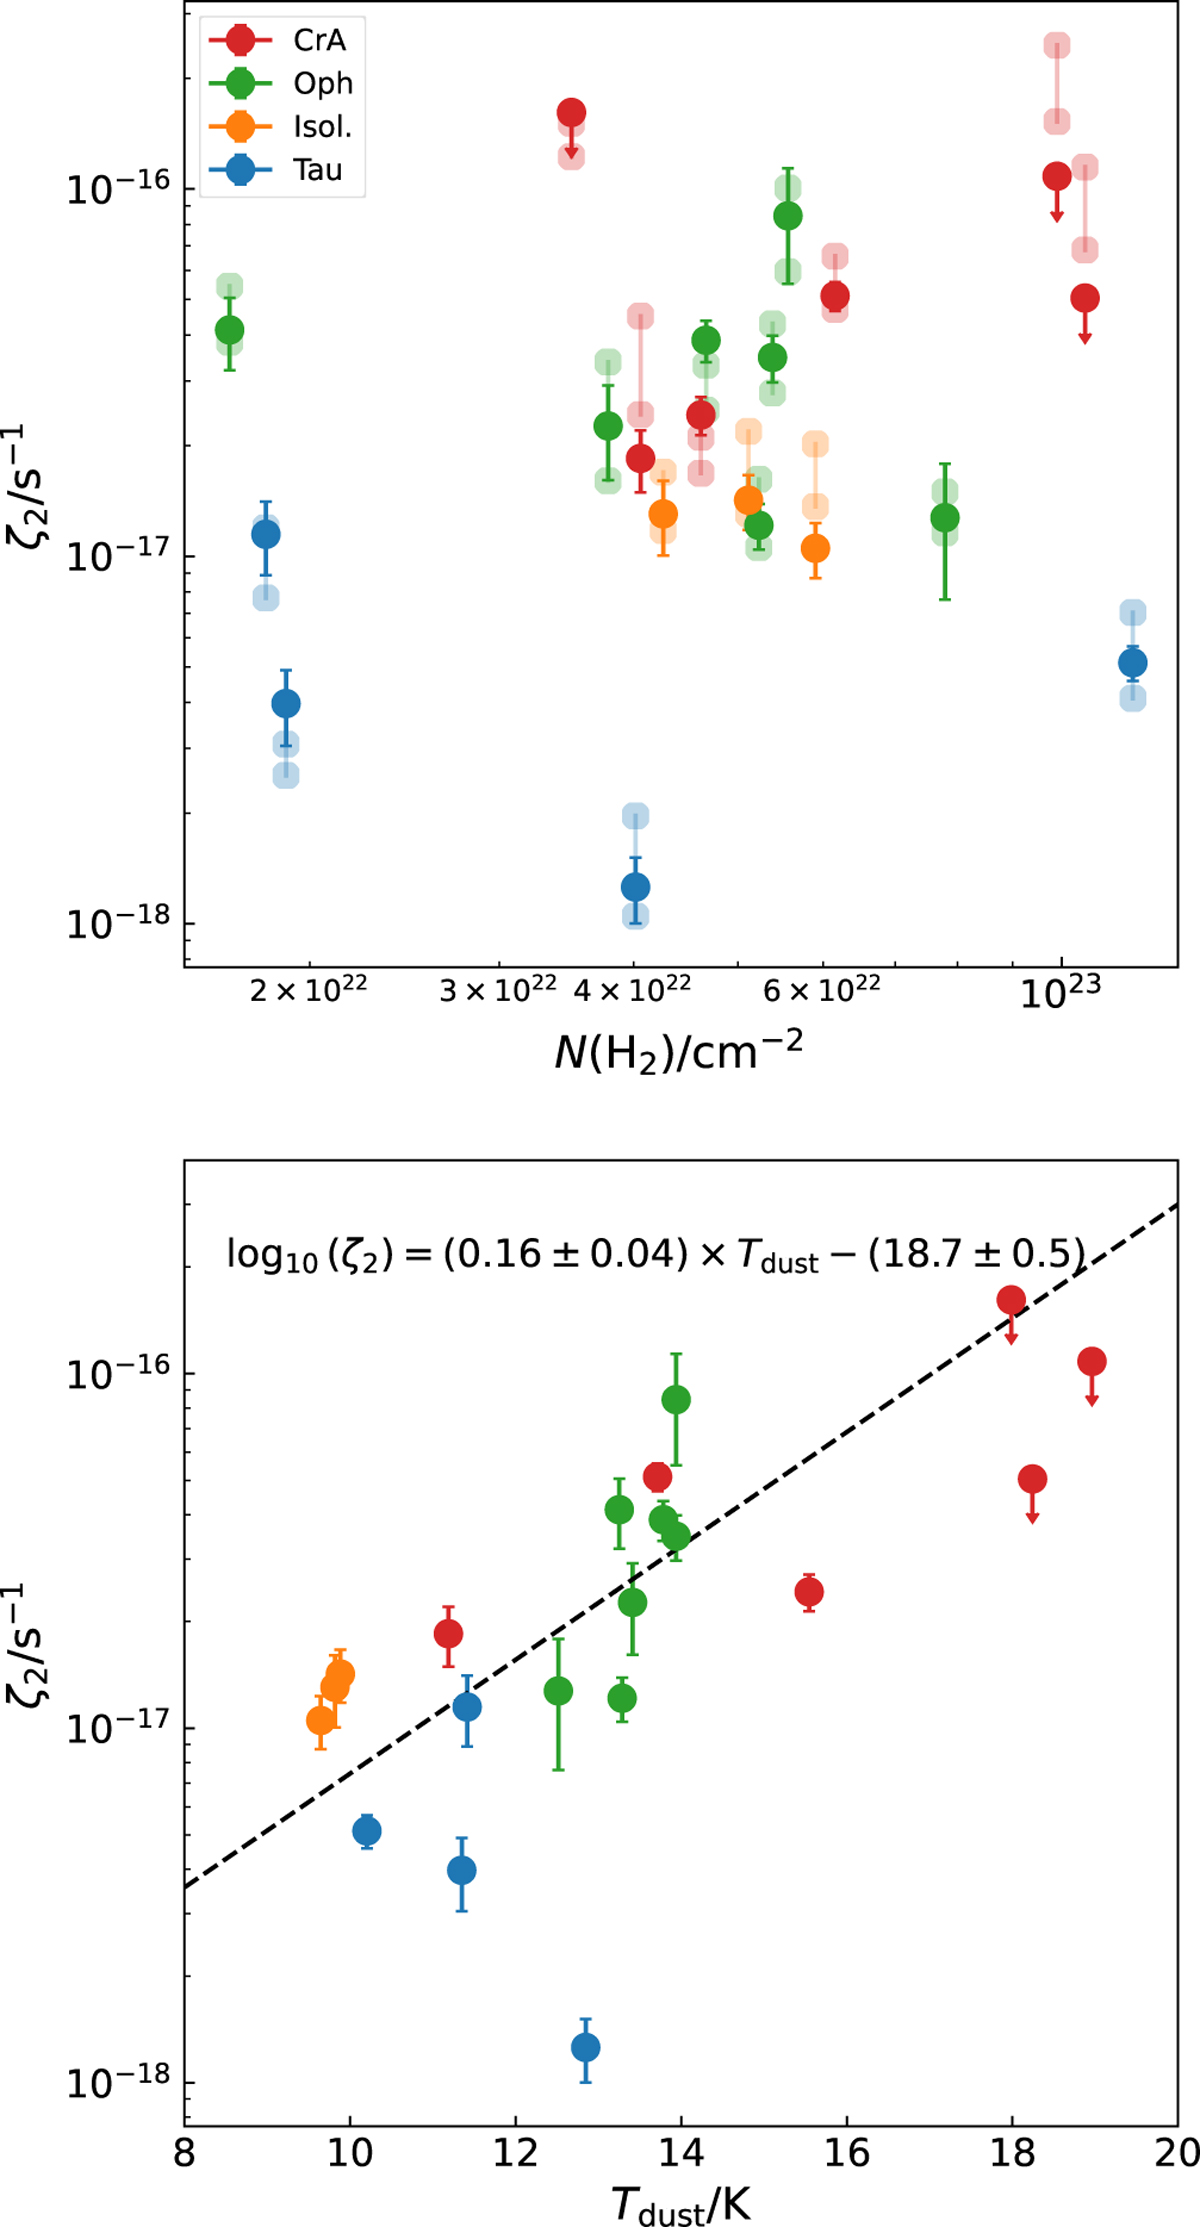
Upper panel: obtained ζ2 values are plotted as function of total gas column density towards each core (including the column density integrated along the line of sight). The solid points and error bars are computed using L = 0.1 pc. The upper limits are shown with downward arrows. The transparent points show the range of ζ2 values obtained when L is computed using the 40% or 60% contours of N(H2). as described in the main text. Lower panel: ζ2 values (computed for L = 0.1 pc) are plotted as a function of the core’s dust temperature, as derived from the Herschel maps. The dashed line shows the linear regression computed in the log10(ζ2)-Tdust plane, and the computed regression coefficients are shown at the top of the panel. In both panels, the data points are colour-coded by parental cloud (red: Corona Australis; green: Ophiuchus; blue: Taurus; orange: isolated sources).
Current usage metrics show cumulative count of Article Views (full-text article views including HTML views, PDF and ePub downloads, according to the available data) and Abstracts Views on Vision4Press platform.
Data correspond to usage on the plateform after 2015. The current usage metrics is available 48-96 hours after online publication and is updated daily on week days.
Initial download of the metrics may take a while.