Fig. 9
Download original image
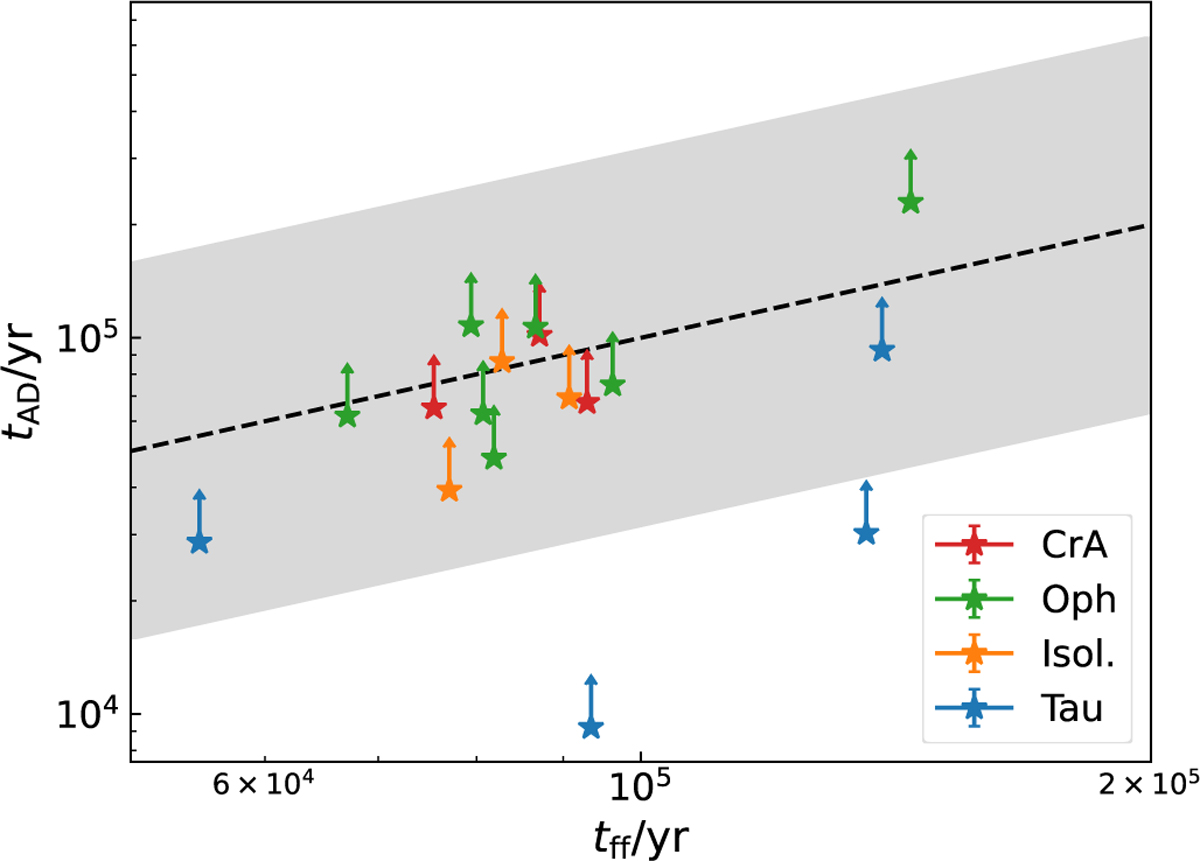
Scatter plot of ambipolar diffusion timescale, tAD, as function of free-fall time, tff, in the targets with detected oH2D+ emission. The tAD values are lower limits, as x(e−) estimated from (2) represents a lower limit. The data points are colour-coded by environment, as in Fig. 7. The dashed line is the 1:1 relation, whilst the shaded area is a 0.5 dex scatter around it (corresponding to the deviation of Eq. (2) from the true value estimated by Latrille et al. 2025).
Current usage metrics show cumulative count of Article Views (full-text article views including HTML views, PDF and ePub downloads, according to the available data) and Abstracts Views on Vision4Press platform.
Data correspond to usage on the plateform after 2015. The current usage metrics is available 48-96 hours after online publication and is updated daily on week days.
Initial download of the metrics may take a while.