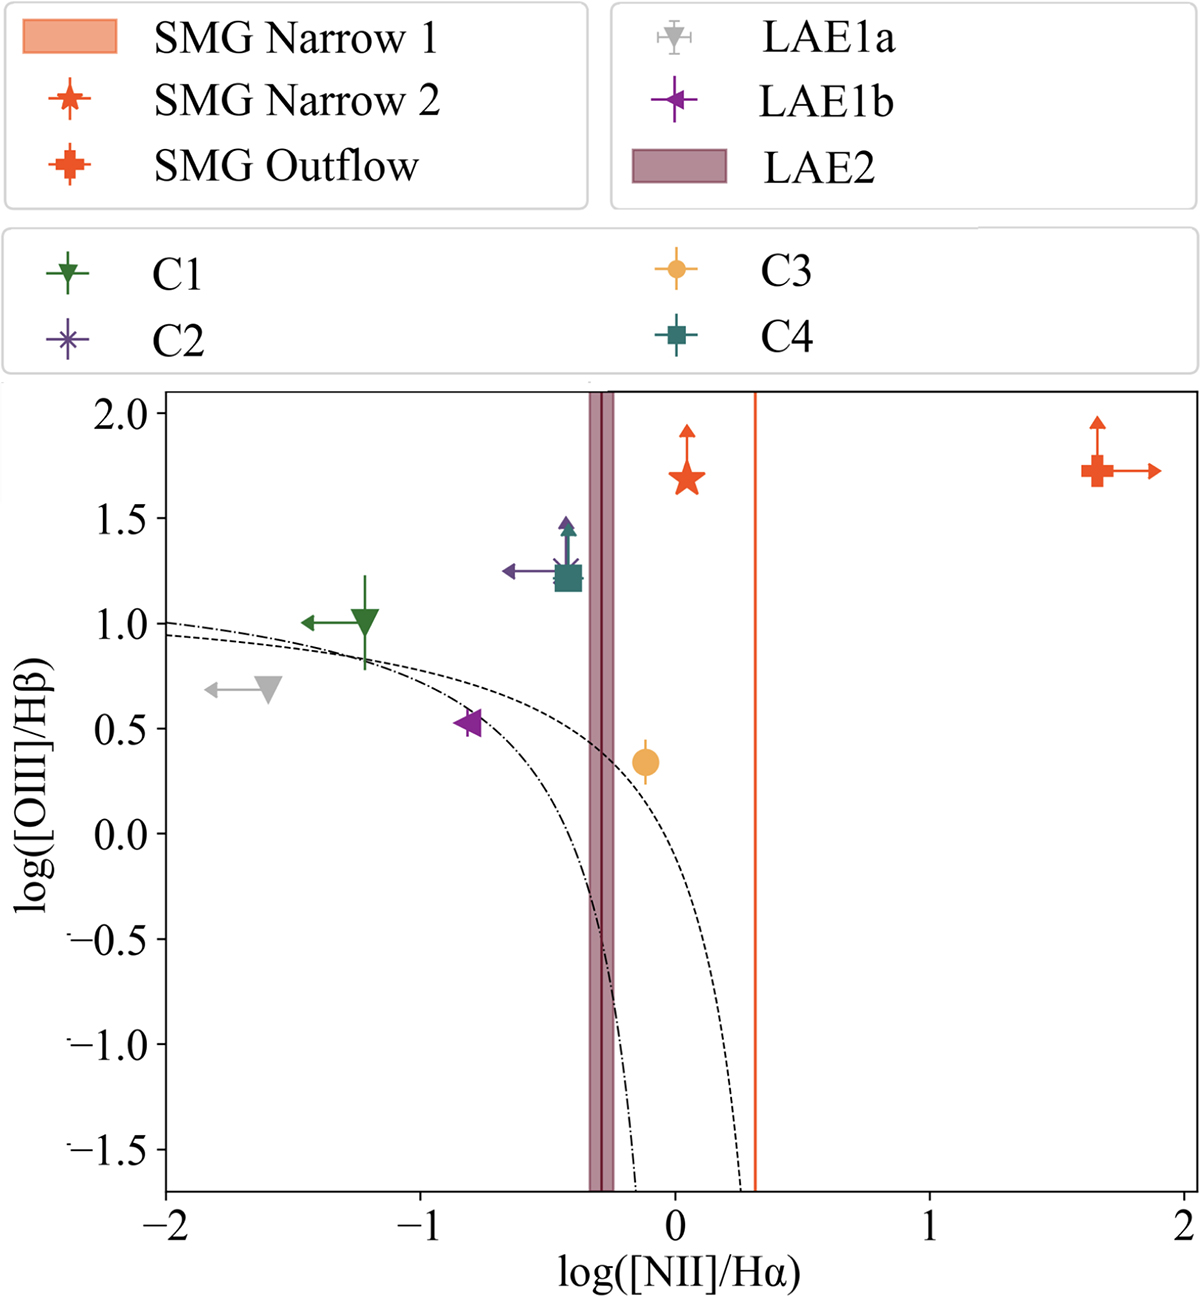
Fig. 12.
Download original image
[O III]/Hβ vs [N II]/Hα BPT diagnostic diagram for all objects analysed. The demarcations between H II and AGN-ionized regions (Kauffmann et al. 2003; Kewley et al. 2001, dash-dotted and dashed black lines, respectively) are reported. The vertical lines indicate the [N II]/Hαratio for the two sources for which we do not have values of [O III] and Hβemission lines, with the errors shown by shaded bands (the errors are not visible for the SMG Narrow 1 component).
Current usage metrics show cumulative count of Article Views (full-text article views including HTML views, PDF and ePub downloads, according to the available data) and Abstracts Views on Vision4Press platform.
Data correspond to usage on the plateform after 2015. The current usage metrics is available 48-96 hours after online publication and is updated daily on week days.
Initial download of the metrics may take a while.