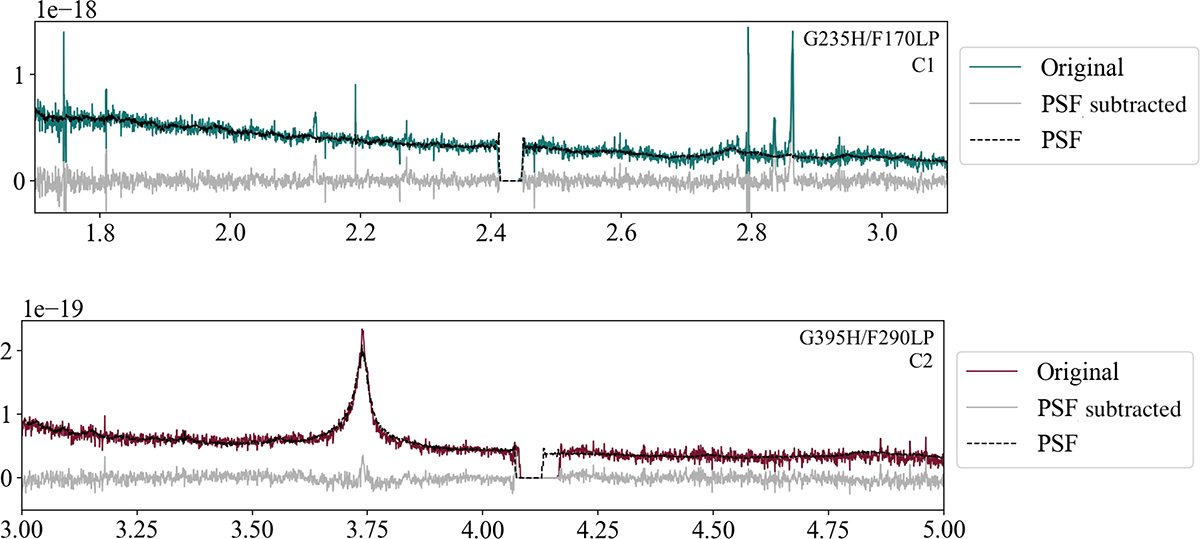
Fig. A.2.
Download original image
Example of two PSF-subtracted spectra in the two different gratings for two different sources (G235H/F170LP for C1 and G395H/F290LP for C2, upper and lower panels, respectively). The modelled PSFs in the same aperture of the integrated spectra (see Sect. 3.3) and the PSF-subtracted spectra are shown with dashed black and solid grey lines, respectively.
Current usage metrics show cumulative count of Article Views (full-text article views including HTML views, PDF and ePub downloads, according to the available data) and Abstracts Views on Vision4Press platform.
Data correspond to usage on the plateform after 2015. The current usage metrics is available 48-96 hours after online publication and is updated daily on week days.
Initial download of the metrics may take a while.