Fig. 4.
Download original image
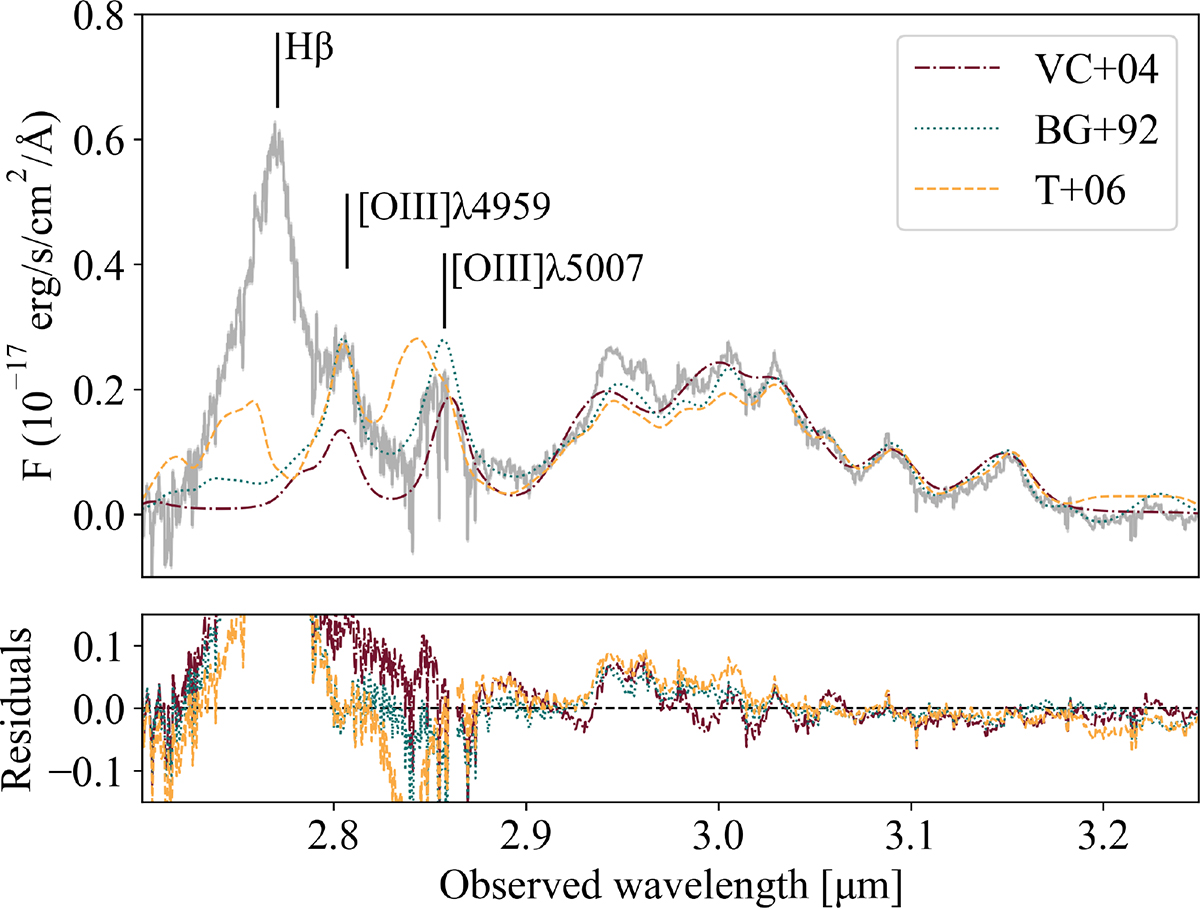
QSO rest-frame optical continuum-subtracted spectrum (grey line) in the spectral region 4700–5400 Å. The emission lines Hβ and [O III] λλ4959,5007 Å (marked with vertical lines) are blended with the Fe II emission, which can be clearly seen at ∼3 μm. The following fitted Fe II templates are shown: Véron-Cetty et al. (2004, VC+04, red line), Boroson & Green (1992, BG+92, blue line), and Tsuzuki et al. (2006, T+06, yellow line). The lines in the bottom panel show the different residuals of the fitting.
Current usage metrics show cumulative count of Article Views (full-text article views including HTML views, PDF and ePub downloads, according to the available data) and Abstracts Views on Vision4Press platform.
Data correspond to usage on the plateform after 2015. The current usage metrics is available 48-96 hours after online publication and is updated daily on week days.
Initial download of the metrics may take a while.