Fig. 8.
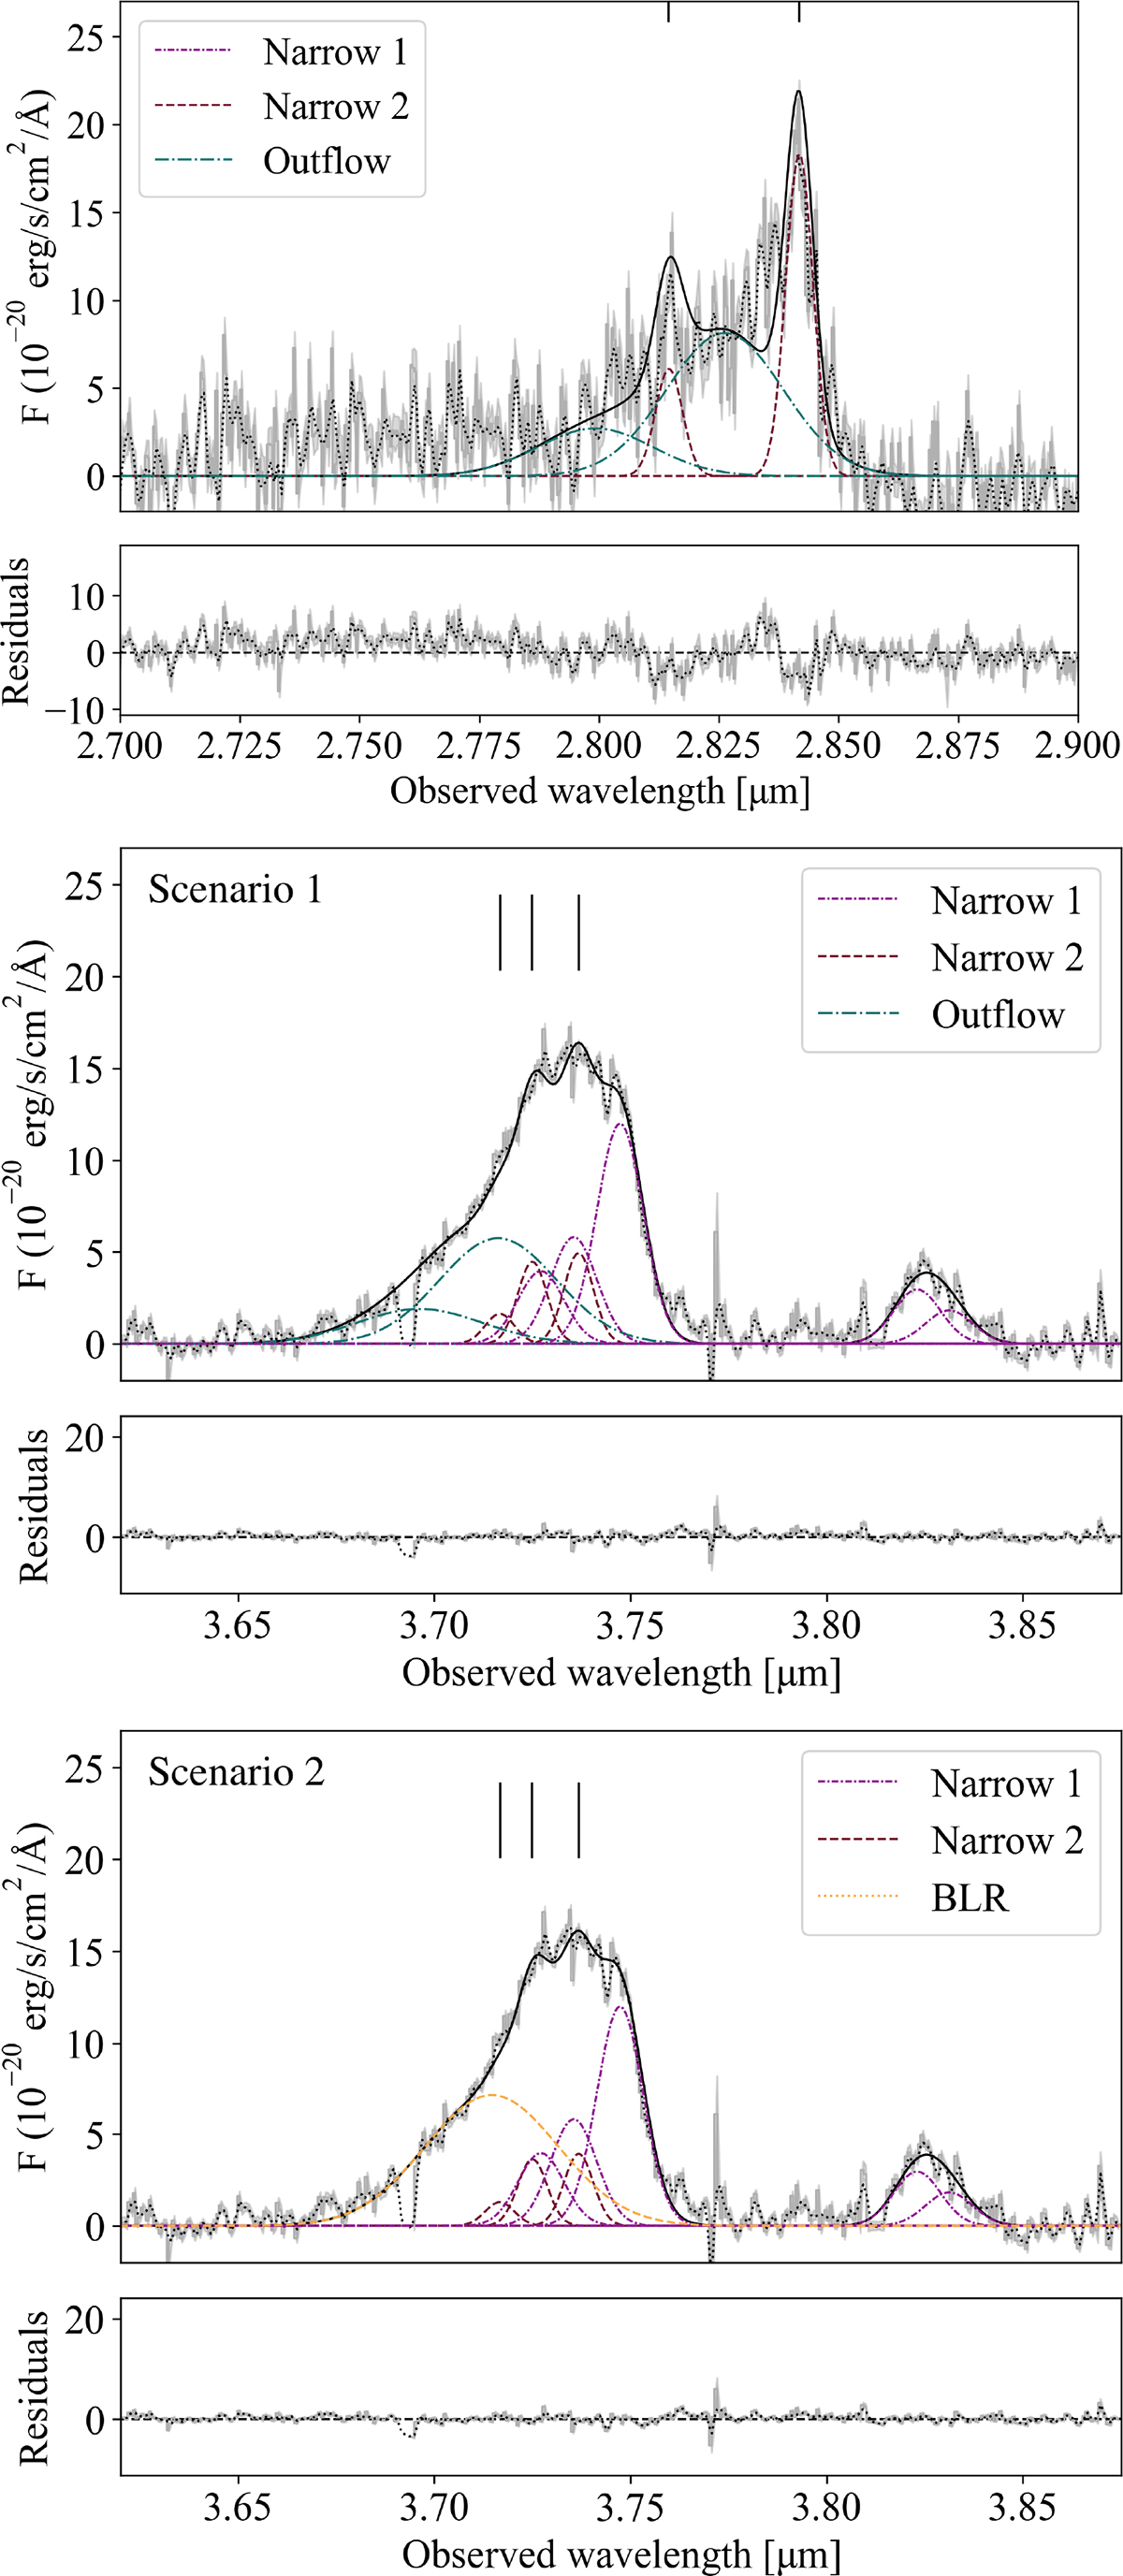
Download original image
Fitting results for the SMG spectrum, showing the Narrow 1, Narrow 2, BLR, and Outflow components (dotted purple, dashed red, dashed yellow, and dash-dotted blue lines, respectively). The errors considered in the fitting procedure are displayed in grey and the residuals of the fits are shown at the bottom of each panel. Top panel: Fit of the [O III] λλ4959,5007 Å emission lines. The vertical dotted lines mark the position of [O III] at the systemic redshift determined from [C II]. Middle and bottom panels: Fits of the Hα, [N II] λλ6548,6584 Å, and [S II] λλ6717,6731 Å emission lines for the first (outflow) and second (BLR) scenarios described in Sect. 5. The vertical black lines indicate the position of the emission lines for the Narrow 2 component found in [O III].
Current usage metrics show cumulative count of Article Views (full-text article views including HTML views, PDF and ePub downloads, according to the available data) and Abstracts Views on Vision4Press platform.
Data correspond to usage on the plateform after 2015. The current usage metrics is available 48-96 hours after online publication and is updated daily on week days.
Initial download of the metrics may take a while.