Fig. 1
Download original image
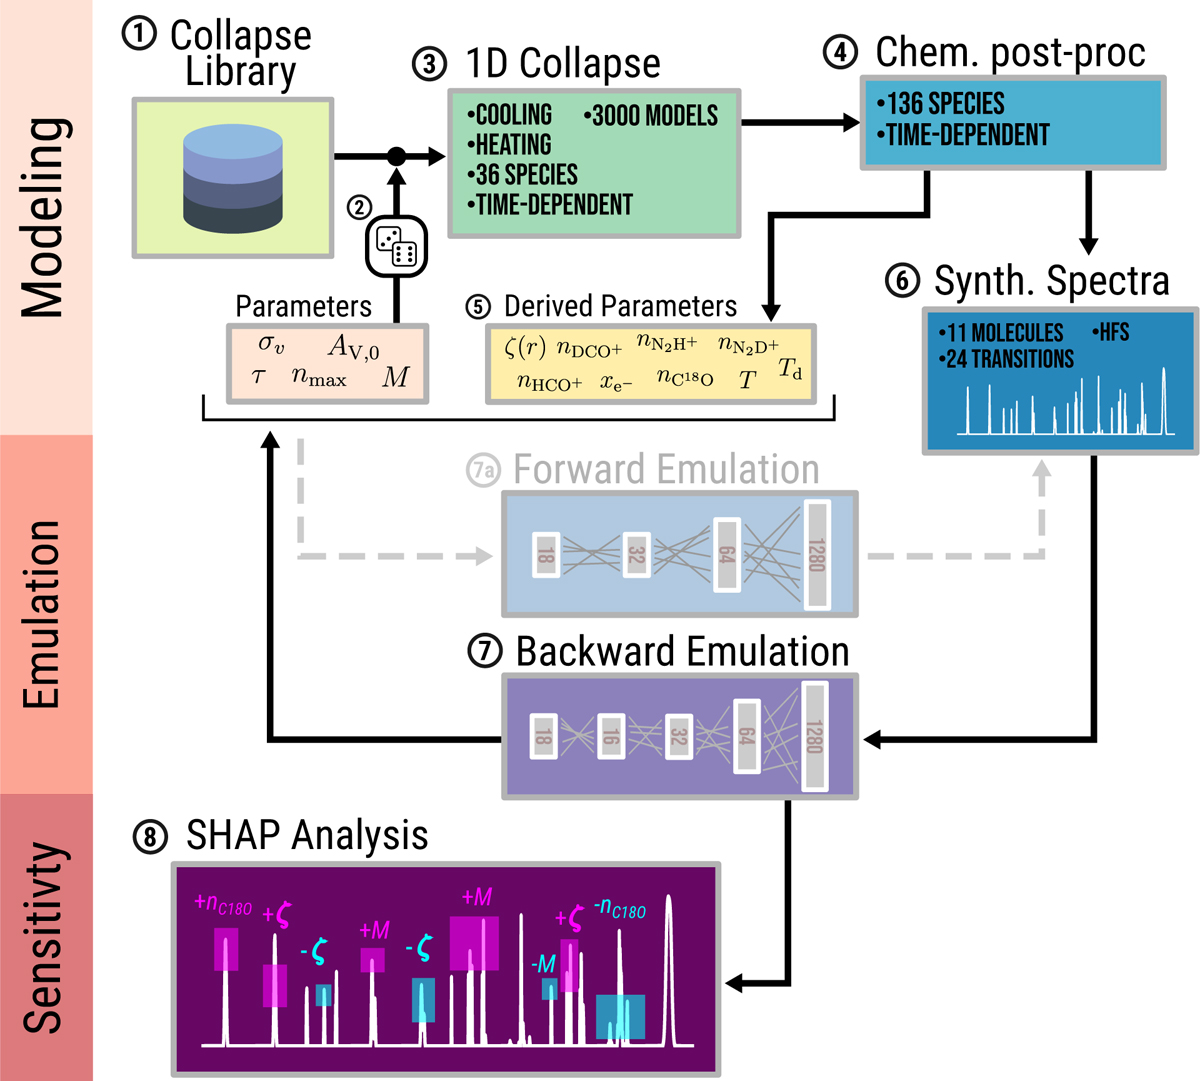
Schematic diagram of the procedure employed in this work. The top part represents the modeling steps: (1) generating the library of gravitational collapse models; (2) randomly selecting the base models depending on the global parameters; (3) evolving the thermochemistry in the collapse model; (4) including additional chemistry with post-processing; (5) obtaining the derived quantities (e.g., the abundances of some key species); and (6) producing the synthetic spectra. The middle part is the emulation: (7a) forward emulation, from parameters to spectra; (7) backward emulation, from spectra to parameters. The sensitivity using SHAP at the bottom (8) is where we perturb the neural network input features to determine the impact on the outputs.
Current usage metrics show cumulative count of Article Views (full-text article views including HTML views, PDF and ePub downloads, according to the available data) and Abstracts Views on Vision4Press platform.
Data correspond to usage on the plateform after 2015. The current usage metrics is available 48-96 hours after online publication and is updated daily on week days.
Initial download of the metrics may take a while.