Fig. C.1
Download original image
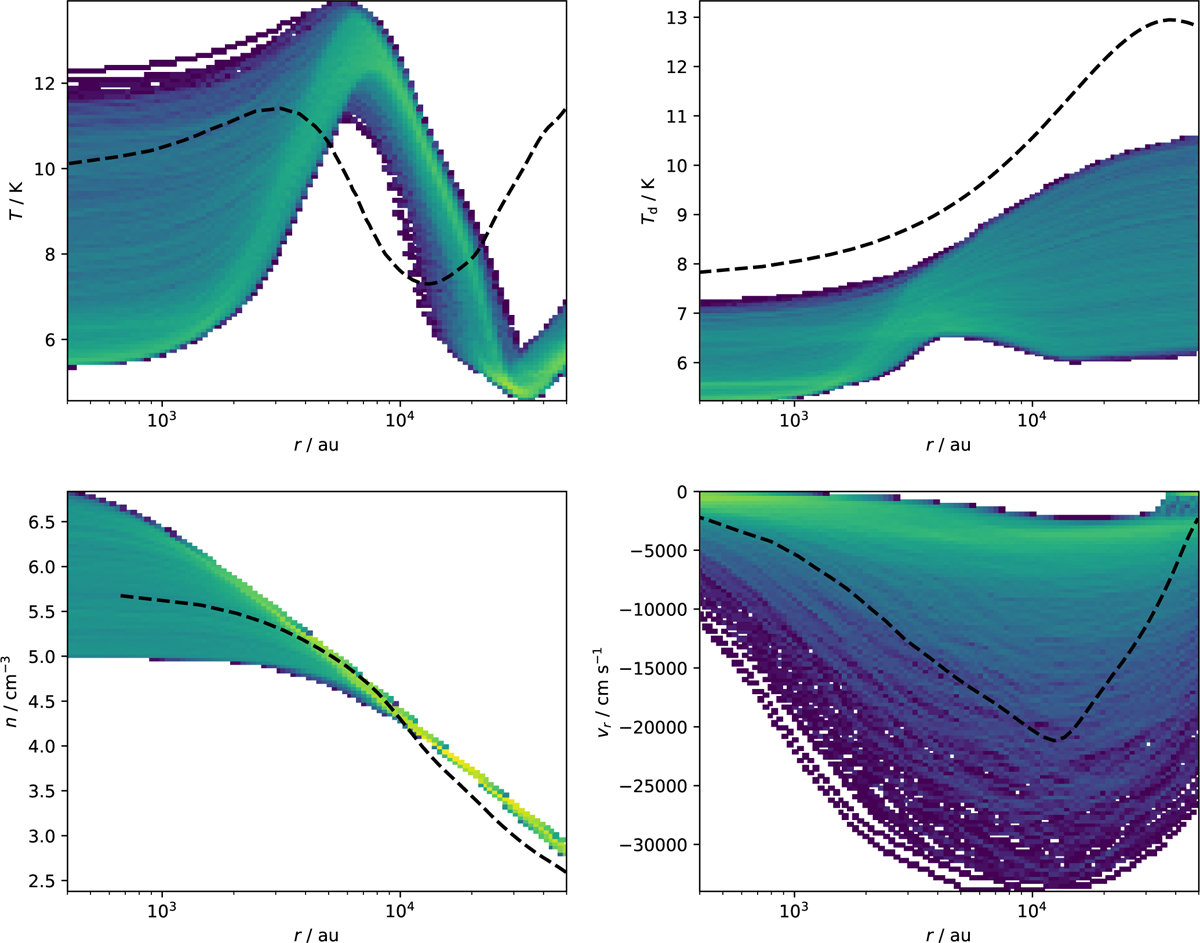
Radial profiles for different quantities (gas temperature T, dust temperature Td, density n, and radial velocity υr) as density probability of our models’ sample (color plot), compared with Fig. 3 of Sipilä et al. (2022), at t = 7.19 × 10⁵ yr (dashed lines). The probability density is vertically normalized to have the same integral value (i.e., unity) at each radius. We note the log-scaled radius.
Current usage metrics show cumulative count of Article Views (full-text article views including HTML views, PDF and ePub downloads, according to the available data) and Abstracts Views on Vision4Press platform.
Data correspond to usage on the plateform after 2015. The current usage metrics is available 48-96 hours after online publication and is updated daily on week days.
Initial download of the metrics may take a while.