Fig. 2
Download original image
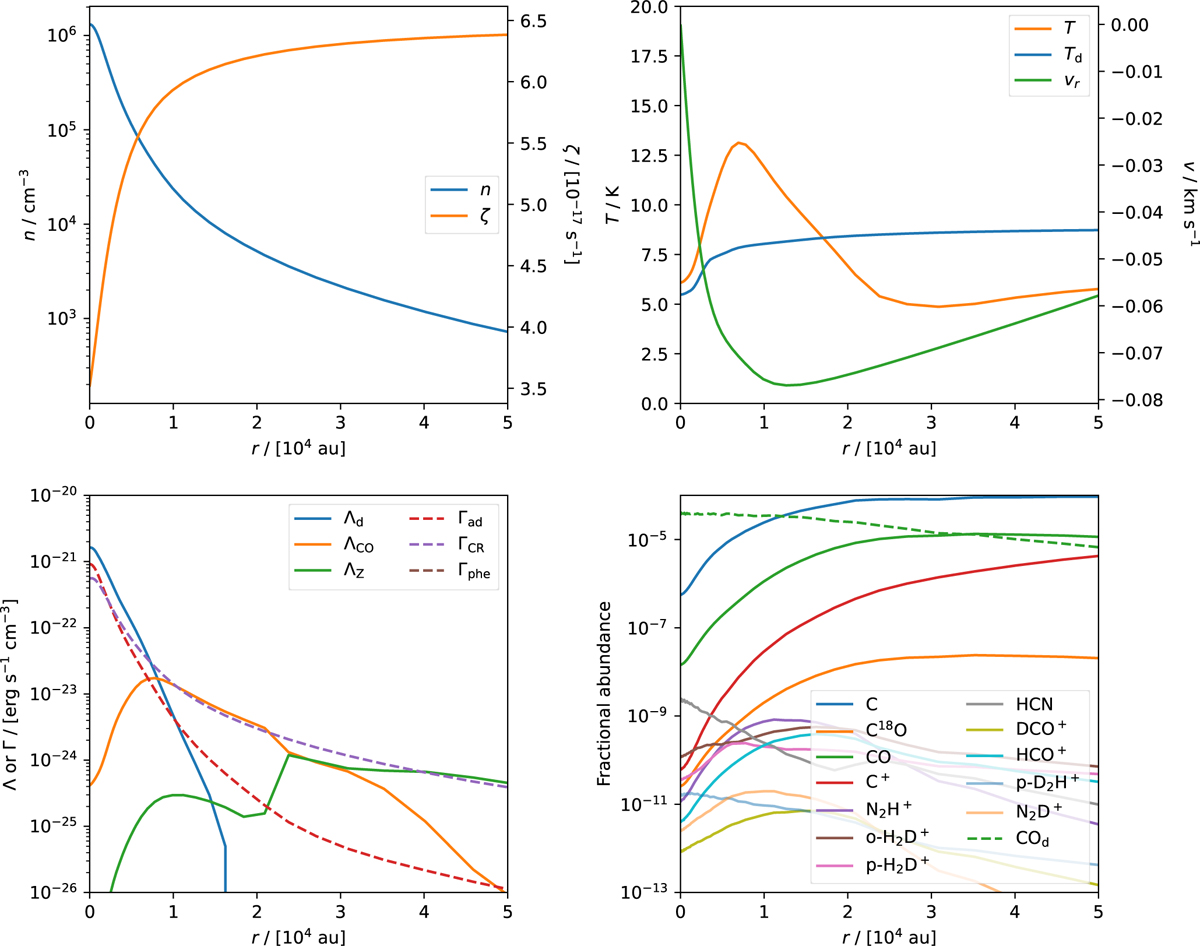
Example model from the population synthesis set at tmax. The x-axis of each panel spans approximately 0.3 pc, or 350” assuming a cloud distant 170 pc from the observer. For the sake of clarity, this plot shows a smaller inner region of the actual computational domain. Upper left panel: Total number density radial profile (blue curve, left y-scale), cosmic-ray ionization rate ζ (orange, right y-scale). Upper right: Gas (orange) and dust (blue) temperature radial profiles (both on left y-scale), and radial velocity profile (green, right y-scale). Lower left: Cooling and heating contributions. In particular, Λd is the dust cooling, ΛCO the CO cooling, ΛZ the cooling from atomic species (C, C+, and O); instead, Γad is the adiabatic heating (i.e., compressional heating), ΓCR the cosmic-ray heating, and Γphe the dust photoelectric heating. The cooling and heating contributions below 10−26 erg s−1 cm−3 are not reported in the legend. Lower right: Radial profile of a subset of the chemical species computed with the network of 4406 reactions. The fractional abundance is relative to the total number density. COd (dashed green) is the CO on the dust surface. The comparison with Sipilä & Caselli (2018) is reported in Appendix C.
Current usage metrics show cumulative count of Article Views (full-text article views including HTML views, PDF and ePub downloads, according to the available data) and Abstracts Views on Vision4Press platform.
Data correspond to usage on the plateform after 2015. The current usage metrics is available 48-96 hours after online publication and is updated daily on week days.
Initial download of the metrics may take a while.