Fig. 3
Download original image
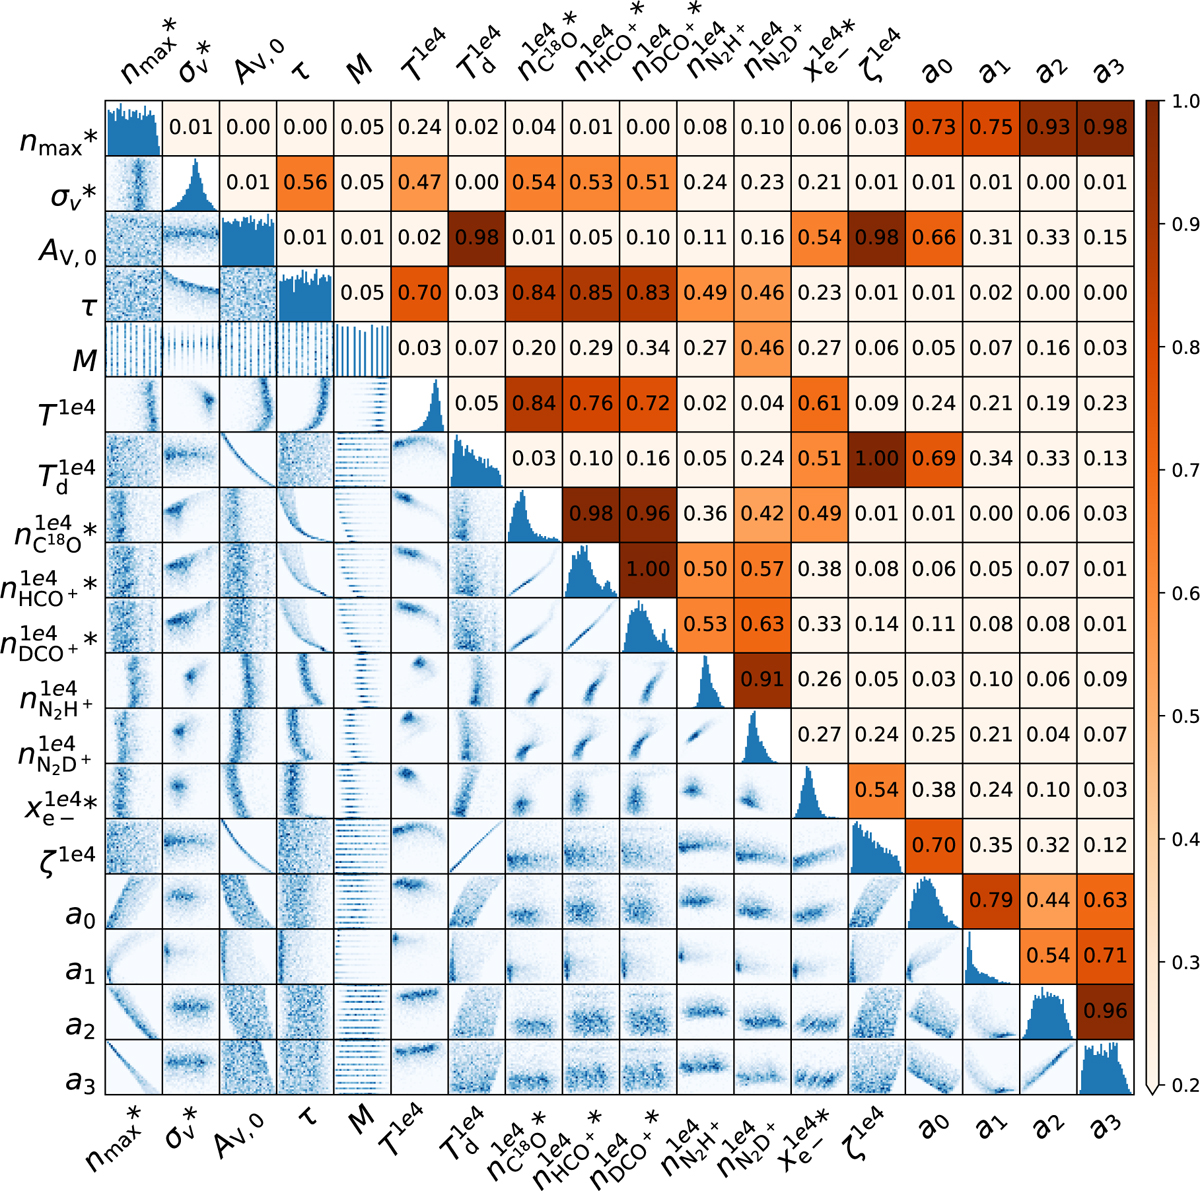
Correlation matrix between the parameters of the models. The panels in the upper left triangle show the Pearson correlation coefficient, color-coded as indicated by the color bar. The plots in the lower right triangle show the 2D correlation histograms of the parameters of the 3000 generated models. The panels in the diagonal represent the histogram of the parameter distribution. The correlation for quantities flagged with “*” is computed using their logarithm. We note that the color bar is clipped to 0.2 to enhance the stronger correlations.
Current usage metrics show cumulative count of Article Views (full-text article views including HTML views, PDF and ePub downloads, according to the available data) and Abstracts Views on Vision4Press platform.
Data correspond to usage on the plateform after 2015. The current usage metrics is available 48-96 hours after online publication and is updated daily on week days.
Initial download of the metrics may take a while.