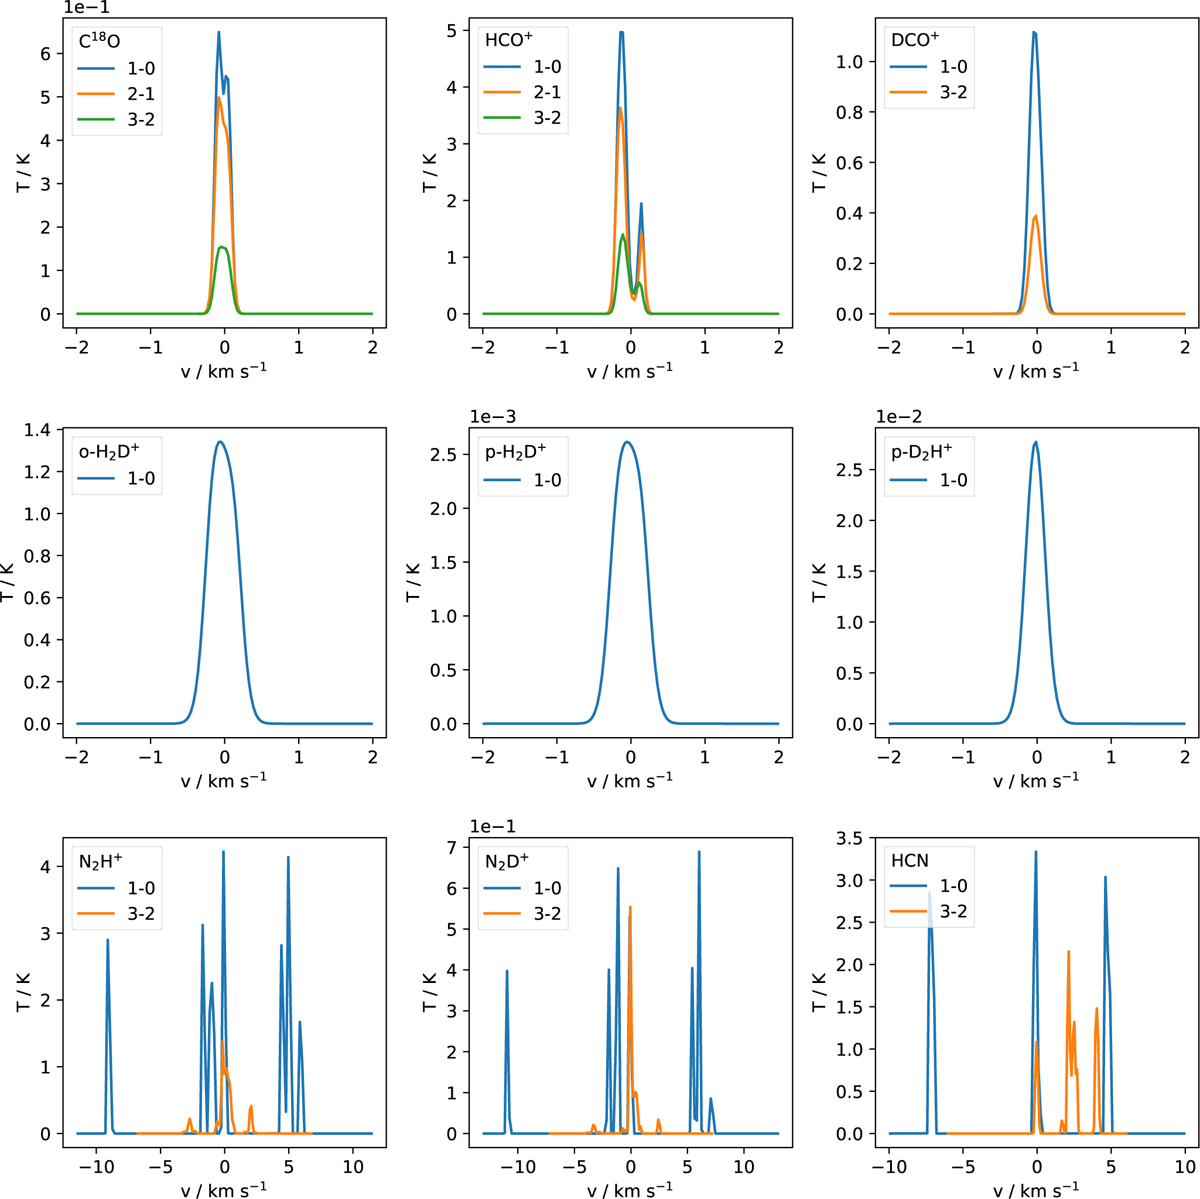
Fig. 4
Download original image
Example spectra for the model in Fig. 2. Each panel reports the spectra of the molecule and the transitions indicated in the legend. The spectra are convoluted with a telescope beam, as discussed in the main text. We note that the y-axis is scaled to the value at the top of the panel, e.g., C18O temperature is scaled to 10−1. All the spectra are calculated with a −2 to +2 km s−1 bandwidth range and 128 channels, except for N2H+, N2D+, and HCN where the bandwidth is calculated by LOC to take into account the hyperfine structure of these molecules, but interpolated to use 128 channels. We also use the spectra centered according to the LOC output (i.e., the position of 0kms−1).
Current usage metrics show cumulative count of Article Views (full-text article views including HTML views, PDF and ePub downloads, according to the available data) and Abstracts Views on Vision4Press platform.
Data correspond to usage on the plateform after 2015. The current usage metrics is available 48-96 hours after online publication and is updated daily on week days.
Initial download of the metrics may take a while.