Fig. 7
Download original image
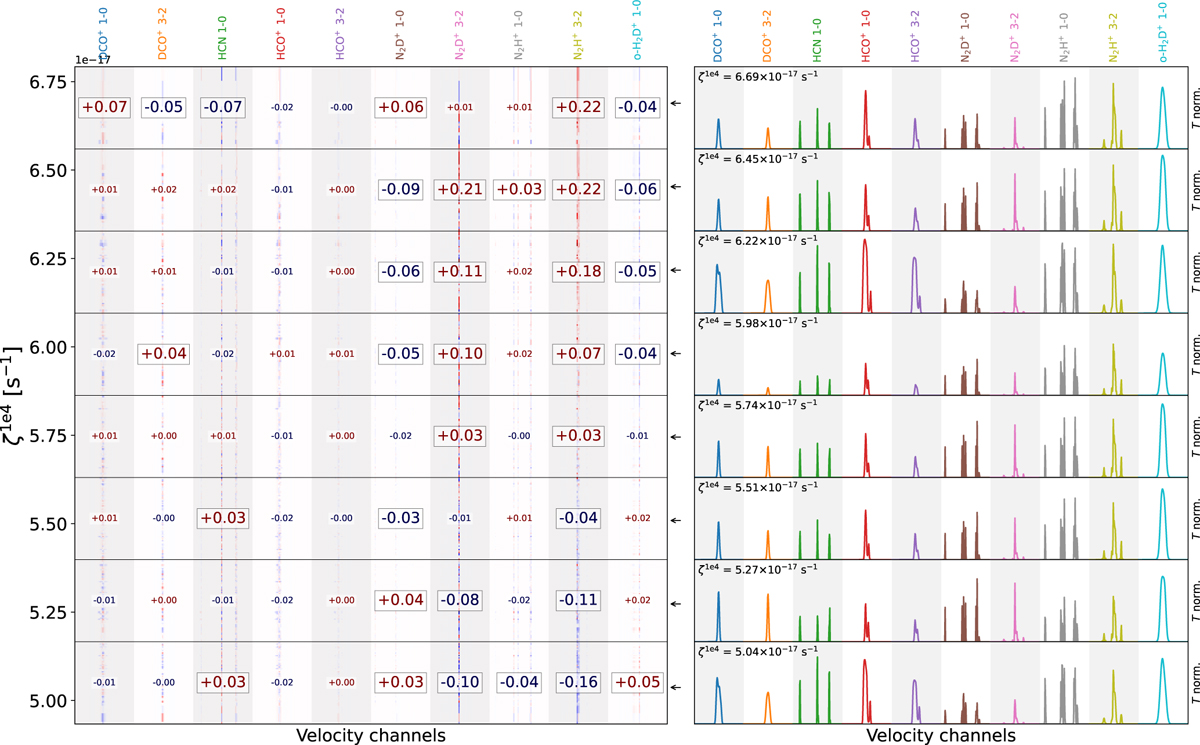
Left panel: Colormap of the SHAP values for each channel and each ζ1e4 value in the test set. The numbers indicate the average of the SHAP value in the given part of the plot. The numbers with bounding boxes have an absolute value larger than 0.03. Right panels: Spectra corresponding to the model at the ζ1e4 value indicated by the arrow (and reported in the upper left part of each panel). For the sake of clarity, the temperature is normalized to the maximum of each transition (similarly to the NN input data normalization). Each color corresponds to a different molecular transition, as labeled at the top. The labels also indicate the correspondence between the channels in the left and right panels.
Current usage metrics show cumulative count of Article Views (full-text article views including HTML views, PDF and ePub downloads, according to the available data) and Abstracts Views on Vision4Press platform.
Data correspond to usage on the plateform after 2015. The current usage metrics is available 48-96 hours after online publication and is updated daily on week days.
Initial download of the metrics may take a while.