Open Access
Fig. 8
Download original image
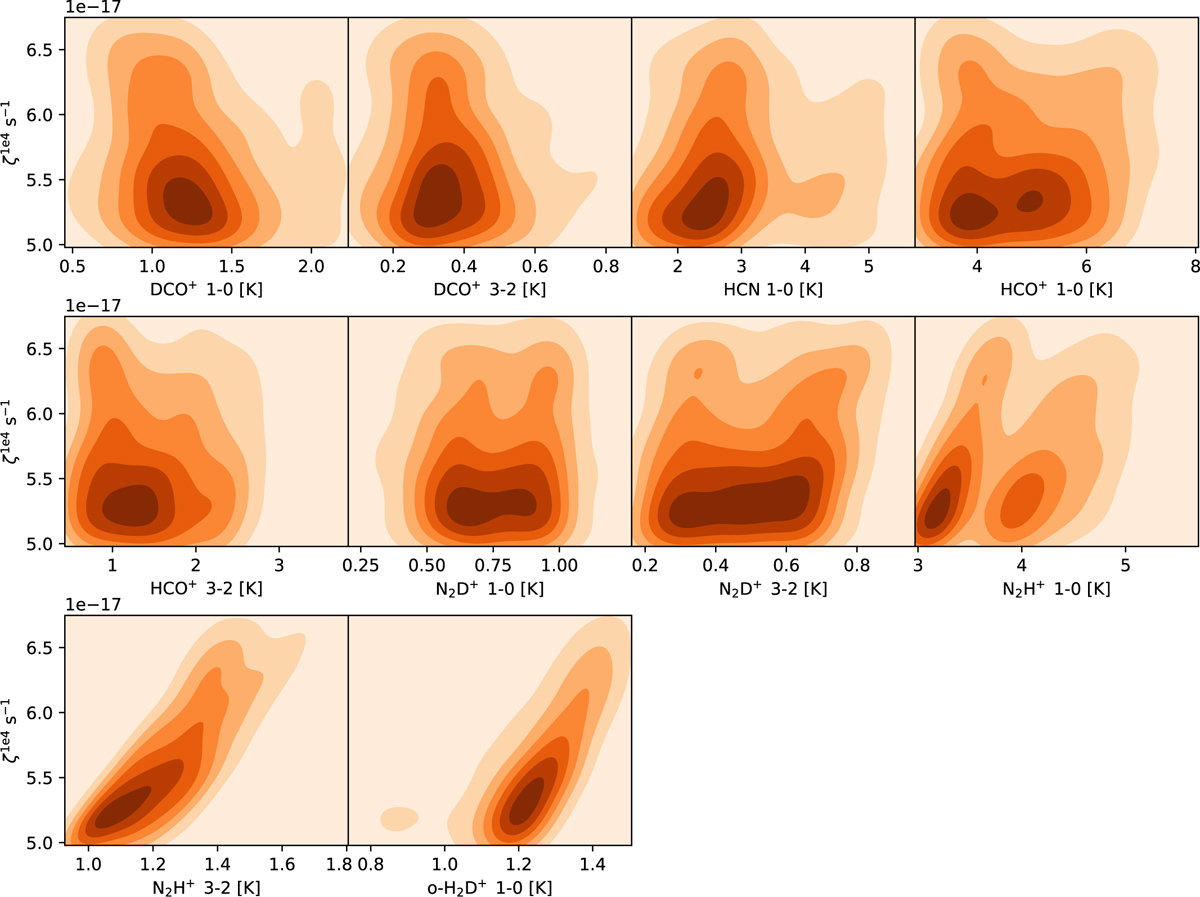
Kernel density estimation of the peak value of the spectrum for each transition (one per panel, see x-axis label) and the ζ1 e4 of the corresponding model (see y-axis label). We note the scaling factor for the y-axis (1e-17), and the varying range of the x-axis. The parameters of the KDE algorithm are the same as in Fig. 6.
Current usage metrics show cumulative count of Article Views (full-text article views including HTML views, PDF and ePub downloads, according to the available data) and Abstracts Views on Vision4Press platform.
Data correspond to usage on the plateform after 2015. The current usage metrics is available 48-96 hours after online publication and is updated daily on week days.
Initial download of the metrics may take a while.