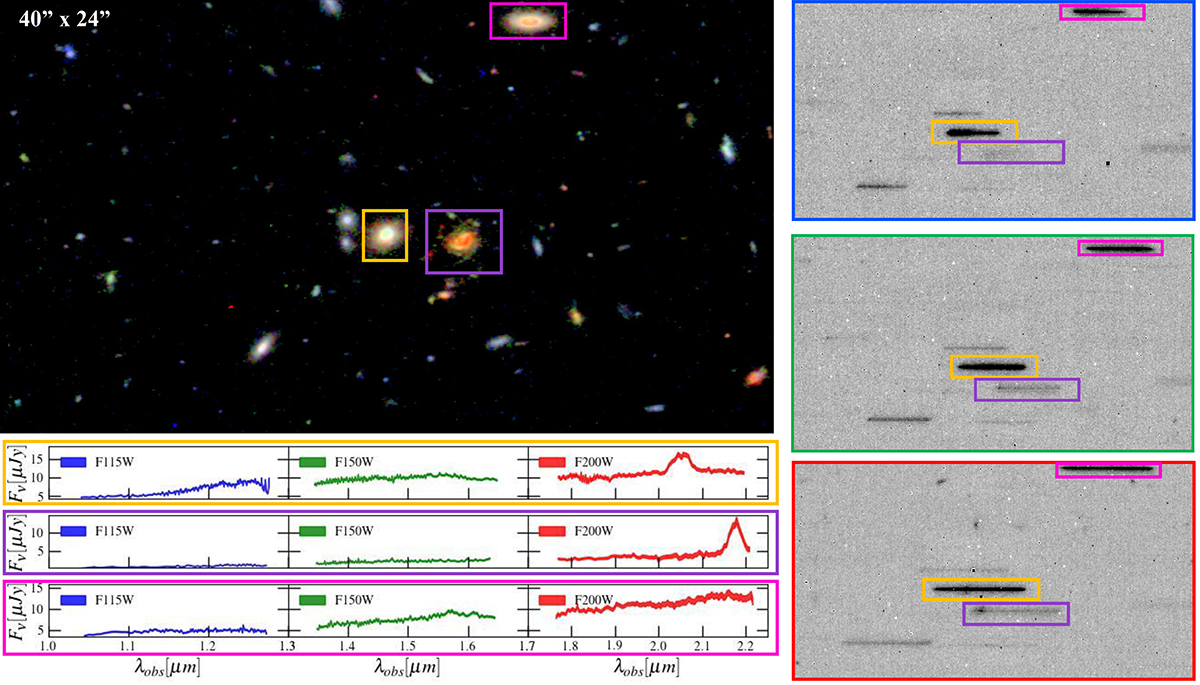
Fig. 2.
Download original image
Top left: RGB cutout of P3, centered on one of the galaxies in the sample. The three squares highlight three massive galaxies in the sample. Right: Single GRISM exposure containing the same objects, in the three filters and for one (GR150C) rotation. Bottom left: Extracted spectra with 3σ errors (shaded areas) of the three galaxies.
Current usage metrics show cumulative count of Article Views (full-text article views including HTML views, PDF and ePub downloads, according to the available data) and Abstracts Views on Vision4Press platform.
Data correspond to usage on the plateform after 2015. The current usage metrics is available 48-96 hours after online publication and is updated daily on week days.
Initial download of the metrics may take a while.