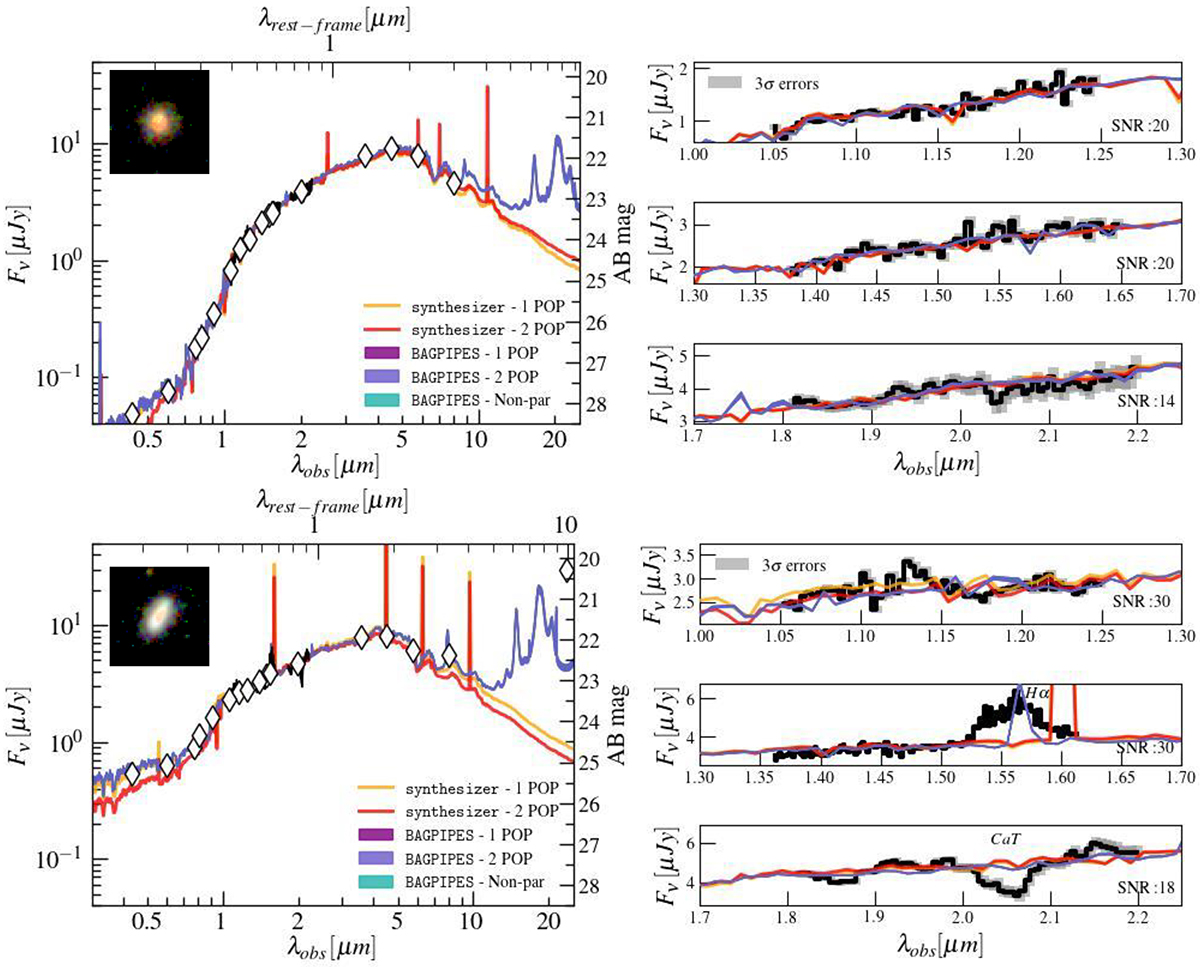
Fig. 5.
Download original image
Spectro-photometric SED-fitting of two galaxies (a quiescent and a star-forming one) in our sample. The lines are the best-fit SEDs from different codes and SFH choice. Photometric data are shown as white diamonds. The error bars are smaller than the size of the points. The 1D spectra in F115W, F150W, and F200W are shown in black. The right panels show a zoomed-in view of the spectra in linear scale. The 3σ errors are plotted as shaded grey areas. We report the median S/N of the 1D spectra.
Current usage metrics show cumulative count of Article Views (full-text article views including HTML views, PDF and ePub downloads, according to the available data) and Abstracts Views on Vision4Press platform.
Data correspond to usage on the plateform after 2015. The current usage metrics is available 48-96 hours after online publication and is updated daily on week days.
Initial download of the metrics may take a while.