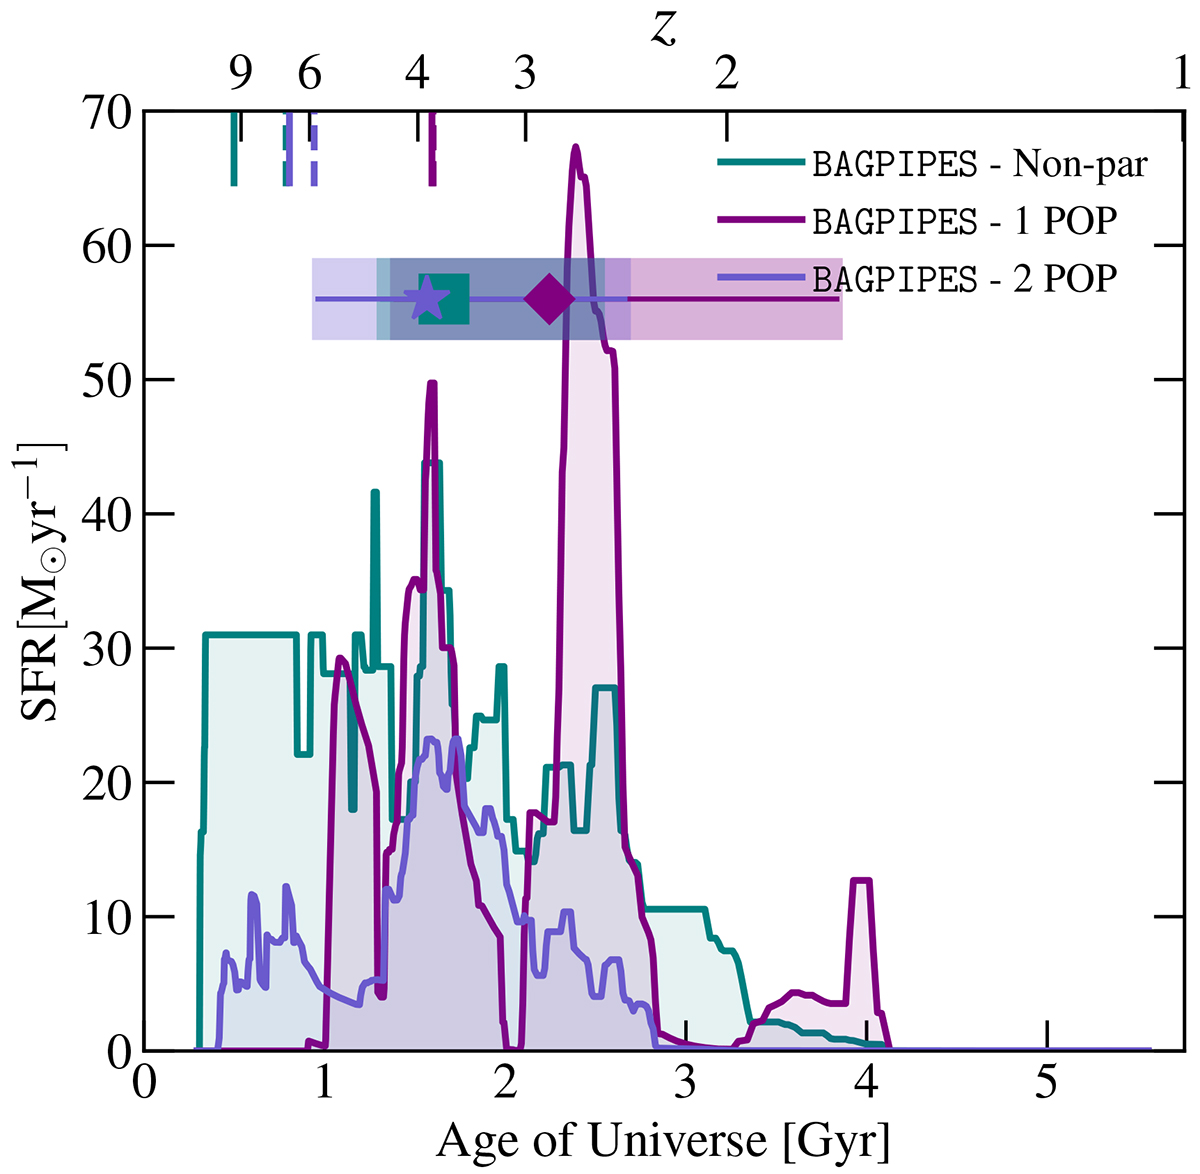
Fig. 9.
Download original image
Average SFHs of galaxies in our sample. The shaded areas correspond to the 16th–84th percentile interval computed from the scatter of the SFHs of all galaxies in our sample. The three points on top show the median formation redshifts; the boxes extend to the 16th and 84th percentiles. Solid vertical lines show the median redshift at which these types of galaxies form 108 M⊙ according to the different models, while dashed vertical lines show the median redshift at which these types of galaxies form 109 M⊙.
Current usage metrics show cumulative count of Article Views (full-text article views including HTML views, PDF and ePub downloads, according to the available data) and Abstracts Views on Vision4Press platform.
Data correspond to usage on the plateform after 2015. The current usage metrics is available 48-96 hours after online publication and is updated daily on week days.
Initial download of the metrics may take a while.