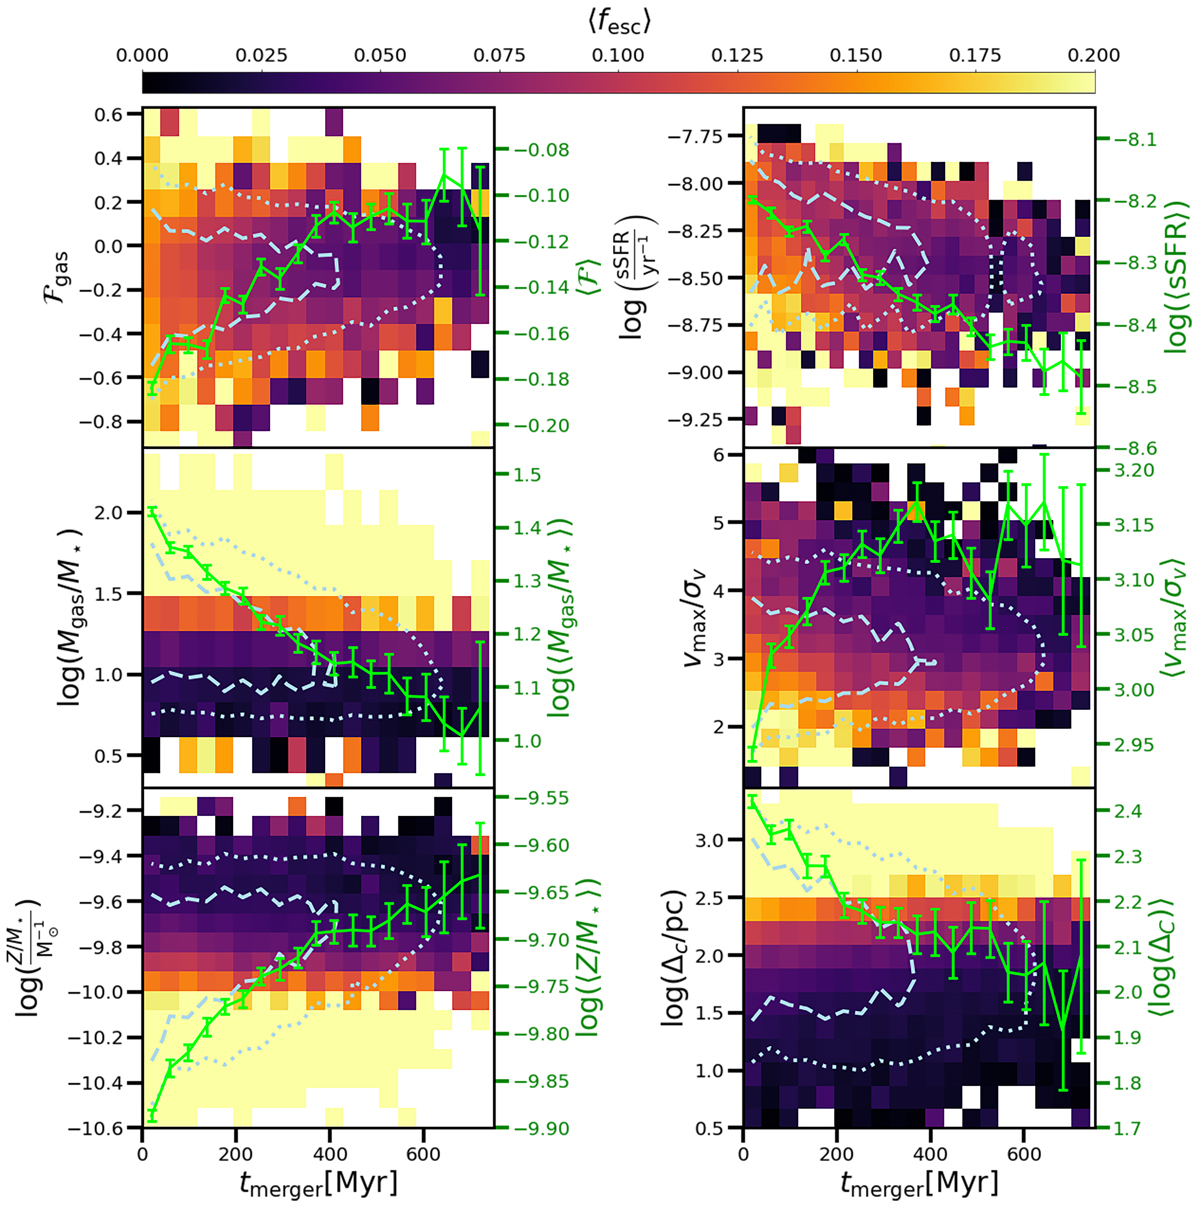
Fig. 5.
Download original image
Histograms showing the average escape fraction (colour bar) as a function of the time since the last major merger for galaxies in the loc-mode with stellar masses M⋆ = (106.8 − 107.2) M⊙. The panels refer to dependence on the gas flow ℱgas (top left), the specific SFR (top right), the ratio of galactic gas and stellar mass (centre left), the ratio of the peak rotational velocity and the one dimensional velocity distribution (centre right), the metallicity of the galaxy normalised by the stellar mass (bottom left), and the distance between the centre of mass of the galactic gas and the centre of mass of the star-forming gas (bottom right). The dashed and dotted lines refer respectively to the one- and two-sigma distribution of galaxy counts, while the green line represents the average value of the given quantity of all galaxies in a given tmerger bin.
Current usage metrics show cumulative count of Article Views (full-text article views including HTML views, PDF and ePub downloads, according to the available data) and Abstracts Views on Vision4Press platform.
Data correspond to usage on the plateform after 2015. The current usage metrics is available 48-96 hours after online publication and is updated daily on week days.
Initial download of the metrics may take a while.