| Issue |
A&A
Volume 702, October 2025
|
|
|---|---|---|
| Article Number | A226 | |
| Number of page(s) | 7 | |
| Section | Extragalactic astronomy | |
| DOI | https://doi.org/10.1051/0004-6361/202453319 | |
| Published online | 24 October 2025 | |
Influence of mergers on the Lyman continuum escape of high-redshift galaxies
1
Max-Planck-Institut für Astrophysik, Karl-Schwarzschild-Str. 1, 85741 Garching, Germany
2
Scuola Normale Superiore, Piazza dei Cavalieri 7, I-50126 Pisa, Italy
⋆ Corresponding author: This email address is being protected from spambots. You need JavaScript enabled to view it.
Received:
5
December
2024
Accepted:
13
August
2025
Abstract
Aims. We investigated the impact of galaxy mergers on the Lyman continuum (LyC) radiation escape, fesc, from high-redshift galaxies.
Methods. We post-processed ≈5 × 10⁵ galaxies (redshift 5.2 < z < 10) extracted from the TNG50 cosmological simulation using a physically motivated analytic model for LyC escape.
Results. Galaxies that have not experienced a merger for the last ≈700 Myr have an average fesc ∼ 3%, which increases up to 14% immediately following a merger. The strongest effect can be observed in galaxies with stellar masses of ∼107 M⊙. We attribute the increase in the escape fraction to two main factors: (i) accretion of metal-poor gas onto the central region of a galaxy, which feeds star formation and LyC emission, and (ii) displacement of neutral gas relative to star-forming regions, which reduces the optical depth to LyC photons. We additionally examined how proximity to other galaxies influences LyC escape, finding that galaxies with more neighbours tend to have more frequent mergers, and thus a higher LyC leakage. However, galaxies in overdense regions tend to have a larger LyC escape fraction independently of mergers because of their higher gas inflow, and consequent increase in the star formation rate. The increase in mergers and in gas inflow could contribute to low-mass galaxies ionising proximity zones of high-z Lyα leakers recently observed with JWST.
Key words: galaxies: evolution / galaxies: formation / galaxies: high-redshift / galaxies: interactions / dark ages, reionization, first stars
© The Authors 2025
 Open Access article, published by EDP Sciences, under the terms of the Creative Commons Attribution License (https://creativecommons.org/licenses/by/4.0), which permits unrestricted use, distribution, and reproduction in any medium, provided the original work is properly cited.
This article is published in open access under the Subscribe to Open model.
Open Access funding provided by Max Planck Society.
1. Introduction
The re-ionisation of the intergalactic medium (IGM) is the last major phase transition undergone by our Universe. Although a consensus has been reached within the community that the process is mainly driven by stellar-type sources, more energetic sources such as accreting black holes or X-ray binaries are expected to contribute to the heating and re-ionisation of the IGM (see e.g. Qin et al. 2017; Dayal et al. 2020; Eide et al. 2020). Constraints on cosmic re-ionisation are limited to an estimate of the global amount of electrons produced during the process through measurements of the Thomson scattering optical depth (Planck Collaboration VI 2020), and of the amount of neutral hydrogen in the IGM during the latest stages of re-ionisation mainly through observations of Lyα emitting galaxies and spectra of quasars and gamma-ray bursts (e.g. Totani et al. 2014; Bañados et al. 2018; Ouchi et al. 2020; Bosman et al. 2022). Observations of the high-redshift universe have been revolutionised by the advent of the James Webb Space Telescope1 (JWST), which is providing increasingly rich information on the properties of high-redshift sources (e.g. Arrabal Haro et al. 2023; Bouwens et al. 2023; Donnan et al. 2023).
A key ingredient for the understanding of re-ionisation processes and of galactic properties is the escape fraction of ionising photons, a quantity that remains poorly constrained by observations (e.g. Vanzella et al. 2018; Bian & Fan 2020; Bosman et al. 2020), and at the same time is extremely difficult to model due to the wide range of scales involved, as well as the dependence on a large number of galactic properties (e.g. Paardekooper et al. 2015; Rosdahl et al. 2018; Ma et al. 2020; Ocvirk et al. 2021; Smith et al. 2022; Kostyuk et al. 2023).
As direct observations of Lyman continuum (LyC) radiation escaping from high-redshift galaxies is hampered by the large IGM opacity, observational efforts have concentrated at intermediate (z ∼ 3) and low (z ∼ 0.2) redshift, and have resulted in a steady increase in the number of known LyC leakers (e.g. Flury et al. 2022). A recent key development has been the identification of possible indirect diagnostics of LyC escape, such as the slope of the LyC radiation (e.g. Chisholm et al. 2022), the prominence of certain metal lines (e.g. Barrow et al. 2020; Nakajima et al. 2020; Katz et al. 2020), or the details of the Lyα emission line (e.g. Dijkstra et al. 2014; Chisholm et al. 2018).
Recently, measurements of the HI 21 cm emission in the nearby re-ionisation-era analogue galaxy Haro 11 presented by Le Reste et al. (2024) have identified galactic mergers as potential facilitators of LyC production and escape in high-redshift galaxies. In particular, the study suggests that repeated gas compression during a merger could drive star formation, thereby increasing LyC production and feedback that clears out channels, thus facilitating LyC escape. Furthermore, the process of tidal gas displacement removes some of the gas around star-forming regions, decreasing LyC photon absorption. In line with these findings, Witten et al. (2024) have proposed that the increased frequency of merger events in overdense regions at high redshifts (z > 7) might contribute to the formation of the large ionised bubbles necessary for the detection of Lyα emitters at these redshifts.
The goal of this work is to use simulations to investigate the physical impact mergers have on early dwarf galaxies that affect LyC escape. To this end, we extended the semianalytic framework developed by Kostyuk et al. (2025; hereafter K25) based on the physical model developed by Ferrara et al. (in prep.; hereafter F25) to describe the dependence of the escape fraction on a number of galactic properties following galactic mergers. The aim is to qualitatively understand how changes in physical properties following a merger impact the LyC escape of galaxies. This paper is structured as follows. In Section 2 we provide a brief introduction to the methodology used for our analysis, in Section 3 we discuss the results, and in Section 4 we provide our conclusions.
2. Methodology
In this section we introduce the basics of the methodology used for our analysis. We refer to K25 for more details.
2.1. Illustris TNG50 simulation
Illustris TNG50 (Nelson et al. 2019; Pillepich et al. 2019) is a large-scale cosmological simulation of length 51.7 cMpc, with initial conditions generated using the N-GenIC code (Springel et al. 2005) and cosmological parameters Ωm = 0.3089, Ωb = 0.0486, ΩΛ = 0.6911, h = 0.6774, σ8 = 0.8159, and ns = 0.9667 (Planck Collaboration I 2016). The simulation was performed on a Voronoi grid using the code AREPO (Springel 2010). Following Weinberger et al. (2017) and Pillepich et al. (2018), the gas particles contained within Voronoi cells with hydrogen number density larger than 0.1 cm−3 are stochastically converted into stellar particles, each representing a stellar population with a Chabrier initial mass function (IMF; Chabrier 2003). The Springel & Hernquist (2003) model for the interstellar medium (ISM) is adopted to include sub-grid processes and pressure support. The initial gas and dark matter particles mass is 8.5 × 10⁴ M⊙ and 4.5 × 10⁵ M⊙, respectively, but these values can change by up to a factor of two due to the refinement and de-refinement of the cells. As a reference, the mean size of star-forming gas cells is 144 ppc at z = 6.
Using the SubFind (Springel et al. 2001) and friends-of-friends (Davis et al. 1985) algorithms, galaxies are identified within sub-halos of minimum mass ∼106 M⊙. A black hole of mass 8 × 10⁵ h−1 M⊙ is seeded in each galaxy that reaches a mass of 1010.8 M⊙, and it subsequently grows through mergers and gas accretion, according to an Eddington limited Bondi formalism. Feedback from black holes and supernovae is modelled as in Weinberger et al. (2017) and Pillepich et al. (2018), respectively. Metal enrichment is included following the individual abundances of elements such as C, N, O, Ne, Mg, Si, Fe, and Eu. Finally, a spatially uniform UV-background (from Faucher-Giguère et al. 2009) is turned on at z < 6. We refer to Nelson et al. (2019) and Pillepich et al. (2019) for further details.
2.2. Escape fraction model
In this section we briefly describe the method used to model the escape fraction of ionising photons. We refer to F25 and K25 for more details.
In this approach a galaxy is modelled as a plane parallel slab2, with ionised radiation produced within the galactic plane, while the gas is distributed above and below it with constant density, n, up to a gas scale height, H. This simplified model is a reasonable approximation given the fact that most of the gas is concentrated within only a few cells in proximity to the galactic disc. Ionising photons are absorbed by gas as well as dust, and are able to escape from the galaxy only if their flux, Fi, is strong enough to form a channel of ionised gas. By expressing the ionising energy flux as a power law with slope β = 4, and using the conversion between UV luminosity and star formation surface density, ΣSFR, adopted by the REBELS collaboration (Dayal et al. 2020), we obtain (see Eqs. 1–3in K25)
 (1)
(1)
where hP is the Planck constant, and κ = 7.1 × 10⁻²⁹ M⊙ yr−1 erg−1 s Hz is a conversion factor appropriate for the Chabrier IMF used in TNG50.
The ionising radiation emitted by the stars is absorbed both by neutral hydrogen (HI) and dust, with optical depth
 (2)
(2)
Here N0 = nH is the gas column density, NS = Fi/(nαB) is the maximum gas column density that can be ionised by the flux Fi, αB is the case B recombination rate, Nd = 4.3 × 10²⁰ 𝒟−1 cm−2 is the gas column density at which the dust optical depth reaches unity, and 𝒟 = Z/Z⊙ is the dust-to-gas ratio normalised to the galactic value obtained assuming a linear relation between metallicity Z and dust (see Eqs. 4–7 in K25).
We then write the LyC escape fraction as fesc = e−(τHI + τd), i.e.
![Mathematical equation: $$ \begin{aligned} f_{\rm esc} = \exp \left[-N_0\left(\frac{1}{N_S}+ \frac{1}{N_d}\right)\right]. \end{aligned} $$](/articles/aa/full_html/2025/10/aa53319-24/aa53319-24-eq3.gif) (3)
(3)
To evaluate the escape fraction of a galaxy, we define the galactic plane as the plane spanned by the first two principle axes of the galaxy, and from it we extract a cube of length equivalent to four times the stellar half-mass radius. The gas particles contained in the cube are then distributed on a Cartesian grid with 1003 cells3. In this framework, H is defined as the height below and above the galactic plane that contains 63% of the gas mass. All the physical quantities necessary to the calculation of the escape fraction are then projected onto the galactic plane and evaluated in each of the 1002 2D grid cells. The escape fraction of a galaxy is then given by
 (4)
(4)
where Fi, cell and fesc, cell are the ionising flux and escape fraction in a cell obtained using Eqs. (1) and (3) with the value of the physical quantities evaluated in each element of the 2D grid as detailed in K25.
Here we calculated the escape fraction of ≈600 000 galaxies with a minimum stellar and gas mass of 105.5 M⊙ and 106 M⊙, respectively, from 17 TNG50 snapshots in the redshift range 5.2 ≤ z ≤ 20. The time since the last mergers was obtained using catalogues based on the work of Rodriguez-Gomez et al. (2017) and Eisert et al. (2023), where the evolution of a galaxy is traced by identifying its particles in subsequent snapshots.
We note that the model presented here is first and foremost designed to qualitatively capture the characteristics of LyC escape and their dependence on galactic properties, rather than to obtain the exact quantitative value of the escape fraction. Given the highly non-linear nature of LyC escape, this is unlikely to be captured by a semi-analytic model. Additionally, as the TNG50 simulation does not fully resolve the interstellar medium (ISM), even with a fully numerical approach such as the one presented in Kostyuk et al. (2023), the exact value of the escape fraction depends on the assumptions adopted to model the unresolved scales. We highlight, though, that this problem afflicts all numerical investigations of LyC escape, as none is presently able to resolve all the scales involved, down to molecular cloud scales.
3. Results
In this section we present the results of our analysis in terms of the global evolution of fesc, its correlation to various galactic properties, and the impact that mergers have on it.
3.1. Global evolution of fesc after mergers
In Fig. 1 we begin our investigation by exploring the evolution of the average (including all galaxies) LyC escape ⟨fesc⟩ as a function of the time elapsed since the most recent major merger event, tmerger (i.e. with a stellar mass ratio > 1/4 between the two merging galaxies), at various redshifts. Here, we see a clear decline of ⟨fesc⟩ with increasing tmerger. Although this trend is consistently observed at all redshifts, it is less pronounced at higher redshift, due to the overall lower value of the LyC escape fraction, as previously shown in K25. When all redshifts are analysed together, ⟨fesc⟩ decreases from ∼14% for galaxies that have experienced a merger within the last ∼50 Myr, to ∼3% in the case of mergers that took place ∼800 Myr prior. Since more massive galaxies experience fewer mergers, it should be noted that the decrease in ⟨fesc⟩ with increasing merger time reflects to some extent the fact that the LyC escape is typically lower in more massive galaxies.
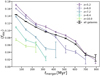 |
Fig. 1. Average LyC escape fraction as a function of time elapsed since the last major merger for galaxies at various redshifts, as indicated by the colours. The black line refers to all redshifts combined. |
Therefore, to disentangle the effects of merger time and galactic mass, in Fig. 2 we examine the average escape fraction as a function of tmerger in different stellar mass bins. We again observe a decline in ⟨fesc⟩ with increasing tmerger, but now it is less pronounced, with the average escape fraction decreasing by approximately 2% in the lowest stellar mass bin, i.e. M⋆ = (106 − 106.2) M⊙. The strongest decline (∼10%) is found at M⋆ = (107.2 − 107.3) M⊙, while for higher masses it becomes smaller again, due to the generally lower LyC escape fractions exhibited by more massive galaxies. The reason for the weaker correlation observed in the lowest mass bin is twofold. First, a significant fraction of galaxies leak LyC through an extended (rather than localised) area, which, as is shown in Fig. 3, is affected differently by mergers. Second, the merger events in these galaxies take place on much shorter timescales, such that the changes in galactic morphology and SFR are not resolved with the time resolution used here. The suggested shorter timescales of merger induced LyC escape aligns with the patterns identified in prior galactic merger simulations. Renaud et al. (2014) find a sequence of multiple star formation bursts over a time span of ∼100 Myr subsequent to the merger event involving galaxies with M⋆ ∼ 1010 M⊙. Conversely, simulations by Lahén et al. (2019) focusing on less massive galaxies with M⋆ ∼ 107 M⊙ produce a single burst of star formation as a consequence of the merger, typically lasting only a few million years. By extrapolating this trend towards lower masses, it can be inferred that galaxies with M⋆ ∼ 106 M⊙ would likely experience even briefer episodes of star formation subsequent to merger occurrences.
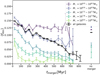 |
Fig. 2. Average LyC escape fraction as a function of time elapsed since the last major merger for galaxies at all examined redshifts with different stellar masses, as indicated by the colours. The black line refers to all masses combined and is the same as in Fig. 1. |
Interestingly, galaxies that have never experienced a merger exhibit significantly higher average escape fractions compared to those that underwent a merger in the more distant past. The elevated average for the no-merger sample is largely driven by a strong bias towards low-mass galaxies, which also renders this dataset uninformative in Fig. 1. The remaining values can be explained by the fact that galaxies that accumulated their stellar mass without mergers tend to have disproportionately high star formation rates, resulting in enhanced LyC production and the formation of more ionised escape channels.
We note here that the same investigation has also been performed on the galaxies analysed in Kostyuk et al. (2023) with a full radiative transfer approach for the evaluation of the escape fraction. While a similar correlation between ⟨fesc⟩ and tmerger is found, it is not shown here as that study was limited to a smaller stellar mass range of (107 − 108) M⊙ and to a smaller number of galaxies, rendering the results less statistically significant.
3.2. Impact of galactic mergers on different escape modes
In K25 we have shown that LyC escapes from early galaxies in two distinct ways. If cooling is efficient in small galaxies (M⋆ ≲ 107 M⊙) and star formation is widespread, LyC escapes over an extended area at the outer regions of the galaxy (in K25 this was referred to as the ext-mode of LyC escape). In this case, the gas scale heights tend to be small (H ≲ 1021 cm), resulting in a higher gas recombination rate, with the consequence that LyC radiation is primarily absorbed by hydrogen. On the other hand, if most star formation takes place in highly localised areas, LyC escapes through small channels near these regions, which are usually located close to the centre of the galaxy (loc-mode). In these galaxies the gas scale heights tend to be larger (H ≳ 1021 cm), decreasing the recombination rate such that in this mode dust significantly contributes to the absorption of LyC radiation.
Due to these significant differences in the mode of LyC escape, in Fig. 3 we investigate the correlation between the average LyC escape fraction and tmerger for galaxies with H < 1021 cm and H > 1021 cm separately. The two modes show a very different evolution. As most galaxies have H > 1021 cm, the evolution for galaxies in which the loc-mode is prevalent looks similar to that of the full sample, as seen from the black lines in Figs. 1 and 2. On the other hand, for galaxies with an ext-mode of escape the correlation differs substantially at tmerger ≲ 400 Myr.
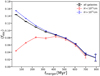 |
Fig. 3. Average LyC escape fraction as a function of time elapsed since the last major merger for galaxies with gas scale height H < 1021 cm (ext-mode of escape) and H > 1021 cm (loc-mode), as well as the full sample. The lines refer to galaxies at all redshifts and stellar masses. |
In Fig. 4 we show histograms of the average escape fraction as a function of the time since the last major merger and the gas scale height4. To avoid the bias introduced by the correlation between galactic stellar mass and merger time observed in Fig. 2, we examine only galaxies with 106.8 M⊙ < M⋆ < 107.2 M⊙. We find that the gas scale height is not greatly affected by a merger in galaxies with an ext-mode of LyC escape (upper panel), while for galaxies with loc-mode (lower) the average gas scale height immediately after a merger is higher by a factor of 1.5 (0.2 dex) than the one 400 Myr after the merger. This is likely caused by tidal disruption of galactic gas during the merger, which enhances LyC escape because the recombination rate scales as ∝H−2. In the ext-mode we see that the average escape fraction is actually lower for smaller gas scale heights, as the LyC production is driven by efficient cooling on the outskirts of the galaxy as described in K25.
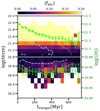 |
Fig. 4. Histogram of the average escape fraction as a function of the time since the last major merger and the gas scale height for galaxies with H > 1021 cm (loc-mode; upper panel) and H < 1021 cm (ext-mode; lower panel). The dashed and dotted lines refer respectively to the one- and two-sigma distribution of galaxy counts of the respective samples, while the green line corresponds to the average gas scale height of all galaxies in a given tmerger bin. |
This example illustrates the reason for the different correlation between mergers and LyC escape observed in Fig. 3. While typically properties of galaxies exhibiting an ext-mode or loc-mode of escape are mostly affected very similarly by mergers, the different evolution of ⟨fesc⟩ arises from its opposite correlation with galactic properties, as illustrated in Fig. 4 for the column height.
3.3. Impact of post-merger galactic properties on the escape fraction
In Fig. 5, we analyse how galactic properties evolve following a merger and how these changes influence the escape fraction. To isolate the effect from its known correlation with stellar mass, we restrict our sample to galaxies within the stellar mass bin M⋆ = 106.8 − 7.2 M⊙. All panels share the same format: the histograms show the average escape fraction of galaxies in each tmerger–property bin, while the green line traces the mean value of the respective property as a function of time since the last major merger. To indicate where the majority of galaxies in our sample is located in parameter space, we overlay contours enclosing the 1σ (dashed) and 2σ (dotted) regions of the distribution.
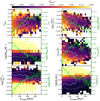 |
Fig. 5. Histograms showing the average escape fraction (colour bar) as a function of the time since the last major merger for galaxies in the loc-mode with stellar masses M⋆ = (106.8 − 107.2) M⊙. The panels refer to dependence on the gas flow ℱgas (top left), the specific SFR (top right), the ratio of galactic gas and stellar mass (centre left), the ratio of the peak rotational velocity and the one dimensional velocity distribution (centre right), the metallicity of the galaxy normalised by the stellar mass (bottom left), and the distance between the centre of mass of the galactic gas and the centre of mass of the star-forming gas (bottom right). The dashed and dotted lines refer respectively to the one- and two-sigma distribution of galaxy counts, while the green line represents the average value of the given quantity of all galaxies in a given tmerger bin. |
The first property we investigated is the directional flow of gas following a merger, which can have a significant impact on the galaxy’s star formation activity and gas distribution, which in turn affects its LyC escape. To investigate this relationship, we define the gas flow as
 (5)
(5)
with pi being the momentum of the gas particle and r0, i the unit vector pointing from the galactic centre to the centre of mass of the gas particles. In other words, this is the ratio between the total gas momentum and the gas momentum of the flow moving away from the galaxy. Here, negative values correspond to gas inflow, with −1 meaning radial collapse, while a value of 1 indicates that all gas flows radially away from the galaxy.
From the top left panel of Fig. 5 we see that shortly after a merger and until tmerger ∼ 300 Myr, on average ℱgas is negative, i.e. we have predominantly gas inflow. The escape fraction has a minimum at ℱgas ∼ 0, with the value increasing for both in- and outflow. While an outflow results in lower column density and optical depth, inflow fuels star formation and the production of LyC photons, which in the loc-mode are able to ionise escape channels. However, as time progresses following a merger, galaxies reach an equilibrium state. As a consequence, the gas inflow decreases, and as a result too few young stars form to ionise escape channels and the escape fraction decreases. This is likely also the reason for the flattening of the specific star formation rate (sSFR) evolution after a similar time as seen on the left.
Next we found that on average the sSFR decreases approximately linearly on a logarithmic scale until 600 Myr after the merger, and subsequently becomes roughly constant. Directly after a merger it is twice as high (0.3 dex) as at tmerger = 600 Myr, likely because of the additional inflow of gas onto the galactic centre. We observed that both high and low values of sSFR lead to an elevated escape fraction. Notably, the location of the minimum in ⟨fesc⟩ as a function of sSFR decreases from sSFR = 10−8 yr−1 at tmerger = 0 Myr to sSFR = 10−8.5 yr−1 at tmerger = 500 Myr. This suggests a non-linear relationship between fesc and inflow rates, which, when substantial enough to support significant star formation, results in higher escape fractions. However, when the sSFR is too low, additional inflow, while boosting the star formation rate, absorbs more LyC radiation than it generates through star formation.
Next, we observed that following a merger event, the additional inflow of gas also results in an increase in the ratio of gas to stellar mass. Within the examined time interval this ratio increases by 0.4 dex (a factor of ∼2.5). This increased availability of gas is expected to fuel star formation, therebycontributing to the formation of pathways for LyC escape. Furthermore, the inflowing gas tends to be more metal poor than the galactic gas, and thus contributes little to dust absorption. Conversely, a higher value of M⋆ corresponds to an increased metallicity within the galaxy, and thus enhanced dust absorption and a reduction in the overall average escape fraction.
The centre right panel shows the ratio vmax/σv, where vmax is the maximum of the rotational velocity and σv is the 1D velocity dispersion. This ratio can be used as a proxy for galactic morphology: higher values characterise disc-like galaxies, while lower values correspond to a more spherical shape. We see that on average vmax/σv decreases after a recent merger, as a consequence of the tidal disruption that galaxies experience. Additionally, as discussed in the first panel, after a merger event gas flow increases, resulting in a larger velocity dispersion. As a consequence of the gas becoming less concentrated, its density and optical depth decrease, and thus the escape fraction increases.
In the bottom left panel we explore the behaviour of the tmerger dependent escape fraction in relation to the metallicity. To remove the bias due to the correlation between Z and M⋆, we introduce the specific metallicity as the metallicity normalised by the stellar mass (Z/M⋆). This quantity decreases on average by approximately 0.3 dex (equivalent to a factor of 2) within the examined tmerger range. This decrease in the specific metallicity is particularly pronounced in the first 300 Myr after a merger. This in turn results in an increase in the average escape fraction of galaxies as can be seen by the contour lines encompassing a larger number of the high ⟨fesc⟩ bins. The cause for this correlation lies in the previously mentioned migration of metal-depleted gas from the CGM towards the inner galactic regions during the merger process. As discussed in K25, dust in the loc-mode significantly contributes to LyC absorption for galaxies in the examined mass range. Given our assumption of a linear relation between metal and dust content, a negative correlation emerges between the specific metallicity and LyC escape.
Finally, Le Reste et al. (2024) have suggested that mergers result in an offset of gas from the star-forming regions, thus facilitating the formation of ionised channels and the escape of radiation. To investigate this, we introduce the quantity ΔC, which is defined as the distance between the centre of mass of all gas within the galaxy and the centre of mass of the star-forming gas. In the lower right panel, we see that ΔC increases after a merger, and that a large offset is strongly correlated with an increase in the escape fraction, which is to be expected because of the reduction in optical depth due to the lower column density. We therefore conclude that for small tmerger, neutral gas is initially offset from the central star-forming regions, but momentum exchange between neutral and star-forming gas slowly reduces this offset leading to a lower ΔC.
3.4. Mergers and increased Lyα visibility
Finally, we tested the suggestion made in Witten et al. (2024) that a merger-driven increase in LyC escape might facilitate the creation of ionised proximity zones surrounding high-z Lyα emitters (LAEs), increasing their visibility. To investigate this hypothesis, in Fig. 6 we show how ⟨fesc⟩ and tmerger are correlated to the average number of neighbours a galaxy possesses within 10 virial radii N10rvir 5, which is a proxy to determine whether a galaxy is located in an over- or underdense region. To ensure that only neighbours that would result in a significant merger are taken into account, we considered only galaxies with masses that are within 0.4 dex below and 0.2 dex above6 the mass of the galaxy under consideration. As before, we performed this analysis for galaxies with M⋆ = 106.8 − 107.2 M⊙. Finally, as we found no significant qualitative variation with redshift, we increased the statistics by considering all redshifts together.
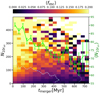 |
Fig. 6. Number of galactic neighbours within 10 virial radii of a galaxy as a function of tmerger in the loc-mode. The dashed and dotted lines refer respectively to the one- and two-sigma distribution of galaxy counts. The green line corresponds to the average value of N10rvir of all galaxies in a given tmerger bin. We inspect galaxies at all redshift with M⋆ = (106.8 − 107.2) M⊙. |
The average number of neighbours decreases for larger tmerger, from 90 for galaxies right after a merger to 65 at tmerger = 600 Myr, supporting the expectation that mergers take place more frequently in overdense environments. The colour gradient along the x-axis indicates that for a fixed number of neighbours, recent mergers increase the escape fraction, supporting the suggestion by Witten et al. (2024) that the more frequent mergers in overdense environments contribute to an increase in LyC escape. However, we additionally see a strong colour gradient along the y-axis, indicating that independently of the last merger, galaxies with more neighbours tend to have higher LyC escape. We have verified that this is likely to be caused by more efficient gas exchange with the environment for galaxies in overdense regions, resulting in higher gas-to-star ratios as well as lower metallicities, which are both correlated with higher escapefractions.
4. Conclusions
Recent observational studies (e.g. Le Reste et al. 2024; Witten et al. 2024) have suggested that mergers of dwarf galaxies at high redshift might be a key cause of LyC leakage. The latter would be fuelled by the increase in star formation associated with gas in-flow, the reduction of gas column density due to tidal disruptions, as well as the offset of neutral gas from the star-forming regions. In this study we have applied the method introduced in Kostyuk et al. (2025) to TNG50 galaxies, and confirmed that also in these simulations LyC escape increases following recent merger events.
We find that the effect is most pronounced in galaxies with M⋆ ≈ 107 M⊙, for which the average escape fraction decreases from 14% immediately after a merger to 3% 700 Myr after the event. It is worth noting that mergers can exert a significant influence even on smaller galaxies, but the effect is expected to occur over timescales shorter than those resolved by the simulation. On the other hand, the absolute decrease in the escape fraction is smaller for higher mass galaxies, given their intrinsically lower escape fraction.
While mergers affect the physical properties of all galaxies in a similar way, the change in these properties has a different impact on the LyC escape, depending on whether a galaxy belongs to the ext- or loc-mode. We find that galactic mergers lead to an increase in fesc only in the more prevalent loc-mode, where LyC leakage takes place mainly from relatively small star-forming regions in the centre of the galaxy. Instead in the ext-mode, where LyC leaks from wide star-forming regions in the outskirts of the galaxy, we found that a merger event decreases the escape fraction in the ext-mode. In this mode the escape fraction is higher ∼200 Myr after a merger than it is immediately following a merger event.
To gain deeper insights into the relationship between LyC escape and galactic mergers, we investigated the correlation between post-merger galactic properties and the resulting LyC escape. We have found that, following a merger, metal-poor gas flows from the galactic environment into the galactic centre, increasing star formation and thus LyC production, which in turn creates more escape channels. Additionally, mergers cause a displacement of neutral gas relative to the star-forming gas, which in turn reduces the opacity for radiation escaping the galaxy.
Finally, we introduced the average number of neighbours a galaxy has within 10 virial radii as a measure for the galactic density of the environment. We found that galaxies having more neighbours tend to have higher escape fractions, due to the more frequent mergers. Additionally, LyC escape from galaxies in overdense regions is increased because of the larger rate of gas inflow, which increases the star formation rate, while decreasing gas absorption due to decreasing metallicity.
In summary, our findings support the observational claims that in the early Universe, merging of dwarf galaxies leads to a substantial enhancement in the escape of LyC radiation.
In the future, we aim to enhance the robustness of our findings by extending our analysis to a wider range of high-redshift simulations in order to investigate the model dependency of our results.
Data availability
The data that support the findings of this study are available upon request from the authors.
Acknowledgments
We thank Rüdiger Pakmor, Aniket Bhagwat, Tiago Costa and Enrico Garaldi for insightful discussions and valuable feedback.
References
- Arrabal Haro, P., Dickinson, M., Finkelstein, S. L., et al. 2023, ApJ, 951, L22 [NASA ADS] [CrossRef] [Google Scholar]
- Bañados, E., Venemans, B. P., Mazzucchelli, C., et al. 2018, Nature, 553, 473 [Google Scholar]
- Barrow, K. S. S., Robertson, B. E., Ellis, R. S., et al. 2020, ApJ, 902, L39 [NASA ADS] [CrossRef] [Google Scholar]
- Bian, F., & Fan, X. 2020, MNRAS, 493, L65 [Google Scholar]
- Bosman, S. E. I., Kakiichi, K., Meyer, R. A., et al. 2020, ApJ, 896, 49 [Google Scholar]
- Bosman, S. E. I., Davies, F. B., Becker, G. D., et al. 2022, MNRAS, 514, 55 [NASA ADS] [CrossRef] [Google Scholar]
- Bouwens, R. J., Stefanon, M., Brammer, G., et al. 2023, MNRAS, 523, 1036 [NASA ADS] [CrossRef] [Google Scholar]
- Chabrier, G. 2003, PASP, 115, 763 [Google Scholar]
- Chisholm, J., Gazagnes, S., Schaerer, D., et al. 2018, A&A, 616, A30 [NASA ADS] [CrossRef] [EDP Sciences] [Google Scholar]
- Chisholm, J., Saldana-Lopez, A., Flury, S., et al. 2022, MNRAS, 517, 5104 [CrossRef] [Google Scholar]
- Davis, M., Efstathiou, G., Frenk, C. S., & White, S. D. 1985, ApJ, 292, 371 [NASA ADS] [CrossRef] [Google Scholar]
- Dayal, P., Volonteri, M., Choudhury, T. R., et al. 2020, MNRAS, 495, 3065 [Google Scholar]
- Dijkstra, M., Wyithe, S., Haiman, Z., Mesinger, A., & Pentericci, L. 2014, MNRAS, 440, 3309 [CrossRef] [Google Scholar]
- Donnan, C. T., McLeod, D. J., Dunlop, J. S., et al. 2023, MNRAS, 518, 6011 [Google Scholar]
- Eide, M. B., Ciardi, B., Graziani, L., et al. 2020, MNRAS, 498, 6083 [Google Scholar]
- Eisert, L., Pillepich, A., Nelson, D., et al. 2023, MNRAS, 519, 2199 [Google Scholar]
- Faucher-Giguère, C.-A., Lidz, A., Zaldarriaga, M., & Hernquist, L. 2009, ApJ, 703, 1416 [Google Scholar]
- Flury, S. R., Jaskot, A. E., Ferguson, H. C., et al. 2022, ApJS, 260, 1 [NASA ADS] [CrossRef] [Google Scholar]
- Katz, H., Crossed D Signurovčíková, D., Kimm, T., et al. 2020, MNRAS, 498, 164 [Google Scholar]
- Kostyuk, I., Nelson, D., Ciardi, B., Glatzle, M., & Pillepich, A. 2023, MNRAS, 521, 3077 [CrossRef] [Google Scholar]
- Kostyuk, I., Ciardi, B., & Ferrara, A. 2025, A&A, 695, A32 [NASA ADS] [CrossRef] [EDP Sciences] [Google Scholar]
- Kravtsov, A. V. 2013, ApJ, 764, L31 [NASA ADS] [CrossRef] [Google Scholar]
- Lahén, N., Naab, T., Johansson, P. H., et al. 2019, ApJ, 879, L18 [CrossRef] [Google Scholar]
- Le Reste, A., Cannon, J. M., Hayes, M. J., et al. 2024, MNRAS, 528, 757 [NASA ADS] [CrossRef] [Google Scholar]
- Ma, X., Quataert, E., Wetzel, A., et al. 2020, MNRAS, 498, 2001 [Google Scholar]
- Nakajima, K., Ellis, R. S., Robertson, B. E., Tang, M., & Stark, D. P. 2020, ApJ, 889, 161 [NASA ADS] [CrossRef] [Google Scholar]
- Nelson, D., Springel, V., Pillepich, A., et al. 2019, Comput. Astrophys. Cosmol., 6, 2 [Google Scholar]
- Ocvirk, P., Lewis, J. S., Gillet, N., et al. 2021, MNRAS, 507, 6108 [NASA ADS] [CrossRef] [Google Scholar]
- Ouchi, M., Ono, Y., & Shibuya, T. 2020, ARA&A, 58, 617 [Google Scholar]
- Paardekooper, J. P., Khochfar, S., & Vecchia, C. D. 2015, MNRAS, 451, 2544 [CrossRef] [Google Scholar]
- Pillepich, A., Springel, V., Nelson, D., et al. 2018, MNRAS, 473, 4077 [Google Scholar]
- Pillepich, A., Nelson, D., Springel, V., et al. 2019, MNRAS, 490, 3196 [Google Scholar]
- Planck Collaboration I. 2016, A&A, 594, A1 [NASA ADS] [CrossRef] [EDP Sciences] [Google Scholar]
- Planck Collaboration VI. 2020, A&A, 641, A6 [NASA ADS] [CrossRef] [EDP Sciences] [Google Scholar]
- Qin, Y., Mutch, S. J., Poole, G. B., et al. 2017, MNRAS, 472, 2009 [NASA ADS] [CrossRef] [Google Scholar]
- Renaud, F., Bournaud, F., & Duc, P.-A. 2014, MNRAS, 446, 2038 [Google Scholar]
- Rodriguez-Gomez, V., Sales, L. V., Genel, S., et al. 2017, MNRAS, 467, 3083 [Google Scholar]
- Rosdahl, J., Katz, H., Blaizot, J., et al. 2018, MNRAS, 479, 994 [NASA ADS] [Google Scholar]
- Smith, A., Kannan, R., Garaldi, E., et al. 2022, MNRAS, 512, 3243 [NASA ADS] [CrossRef] [Google Scholar]
- Springel, V. 2010, MNRAS, 401, 791 [Google Scholar]
- Springel, V., & Hernquist, L. 2003, MNRAS, 339, 289 [Google Scholar]
- Springel, V., White, S. D., Tormen, G., & Kauffmann, G. 2001, MNRAS, 328, 726 [NASA ADS] [CrossRef] [Google Scholar]
- Springel, V., White, S. D., Jenkins, A., et al. 2005, Nature, 435, 629 [Google Scholar]
- Totani, T., Aoki, K., Hattori, T., et al. 2014, PASJ, 66, 63 [NASA ADS] [Google Scholar]
- Vanzella, E., Nonino, M., Cupani, G., et al. 2018, MNRAS, 476, L15 [Google Scholar]
- Weinberger, R., Springel, V., Hernquist, L., et al. 2017, MNRAS, 465, 3291 [Google Scholar]
- Witten, C., Laporte, N., Martin-Alvarez, S., et al. 2024, Nat. Astron., 8, 384 [Google Scholar]
See K25 for a discussion of the validity of this model for non-disc-like galaxies.
The analysis performed in the Appendix of K25 shows that an excellent convergence in the results is reached with this grid size.
The colour scale is capped at ⟨fesc⟩=0.2 to emphasise variations in the average escape fraction. This is a purely arbitrary choice and does not imply any physical limit on ⟨fesc⟩.
As the virial radius is not provided for TNG sub-halos, we used the stellar half-mass radius as a proxy, assuming rSHMR = 0.015rvir (Kravtsov 2013).
The asymmetric binning is based on the idea that the galaxy emerged through the merger of two lighter galaxies. Therefore, slightly smaller galaxies are a better tracer of the merger frequency experienced by a galaxy in a given mass bin.
All Figures
|
Fig. 1. Average LyC escape fraction as a function of time elapsed since the last major merger for galaxies at various redshifts, as indicated by the colours. The black line refers to all redshifts combined. |
| In the text | |
|
Fig. 2. Average LyC escape fraction as a function of time elapsed since the last major merger for galaxies at all examined redshifts with different stellar masses, as indicated by the colours. The black line refers to all masses combined and is the same as in Fig. 1. |
| In the text | |
|
Fig. 3. Average LyC escape fraction as a function of time elapsed since the last major merger for galaxies with gas scale height H < 1021 cm (ext-mode of escape) and H > 1021 cm (loc-mode), as well as the full sample. The lines refer to galaxies at all redshifts and stellar masses. |
| In the text | |
|
Fig. 4. Histogram of the average escape fraction as a function of the time since the last major merger and the gas scale height for galaxies with H > 1021 cm (loc-mode; upper panel) and H < 1021 cm (ext-mode; lower panel). The dashed and dotted lines refer respectively to the one- and two-sigma distribution of galaxy counts of the respective samples, while the green line corresponds to the average gas scale height of all galaxies in a given tmerger bin. |
| In the text | |
|
Fig. 5. Histograms showing the average escape fraction (colour bar) as a function of the time since the last major merger for galaxies in the loc-mode with stellar masses M⋆ = (106.8 − 107.2) M⊙. The panels refer to dependence on the gas flow ℱgas (top left), the specific SFR (top right), the ratio of galactic gas and stellar mass (centre left), the ratio of the peak rotational velocity and the one dimensional velocity distribution (centre right), the metallicity of the galaxy normalised by the stellar mass (bottom left), and the distance between the centre of mass of the galactic gas and the centre of mass of the star-forming gas (bottom right). The dashed and dotted lines refer respectively to the one- and two-sigma distribution of galaxy counts, while the green line represents the average value of the given quantity of all galaxies in a given tmerger bin. |
| In the text | |
|
Fig. 6. Number of galactic neighbours within 10 virial radii of a galaxy as a function of tmerger in the loc-mode. The dashed and dotted lines refer respectively to the one- and two-sigma distribution of galaxy counts. The green line corresponds to the average value of N10rvir of all galaxies in a given tmerger bin. We inspect galaxies at all redshift with M⋆ = (106.8 − 107.2) M⊙. |
| In the text | |
Current usage metrics show cumulative count of Article Views (full-text article views including HTML views, PDF and ePub downloads, according to the available data) and Abstracts Views on Vision4Press platform.
Data correspond to usage on the plateform after 2015. The current usage metrics is available 48-96 hours after online publication and is updated daily on week days.
Initial download of the metrics may take a while.