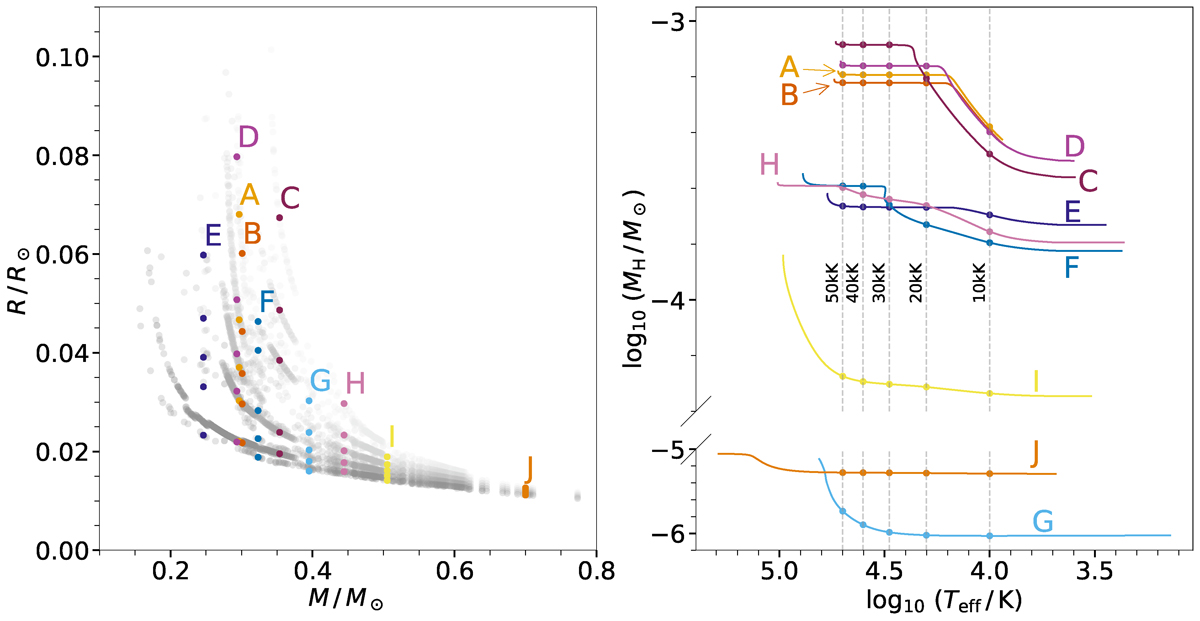
Fig. 2.
Download original image
Mass-radius relation with selected WDs highlighted from 50 kK downward (left panel), and hydrogen mass vs. effective temperature (right panel). The dots correspond to their values at 10, 20, 30, 40, and 50 kK, and each color corresponds to a different WD. The two figures use the same color code. Labels correspond to the notation of Table 1. The hydrogen depletion is due to residual nuclear burning along the final cooling track.
Current usage metrics show cumulative count of Article Views (full-text article views including HTML views, PDF and ePub downloads, according to the available data) and Abstracts Views on Vision4Press platform.
Data correspond to usage on the plateform after 2015. The current usage metrics is available 48-96 hours after online publication and is updated daily on week days.
Initial download of the metrics may take a while.