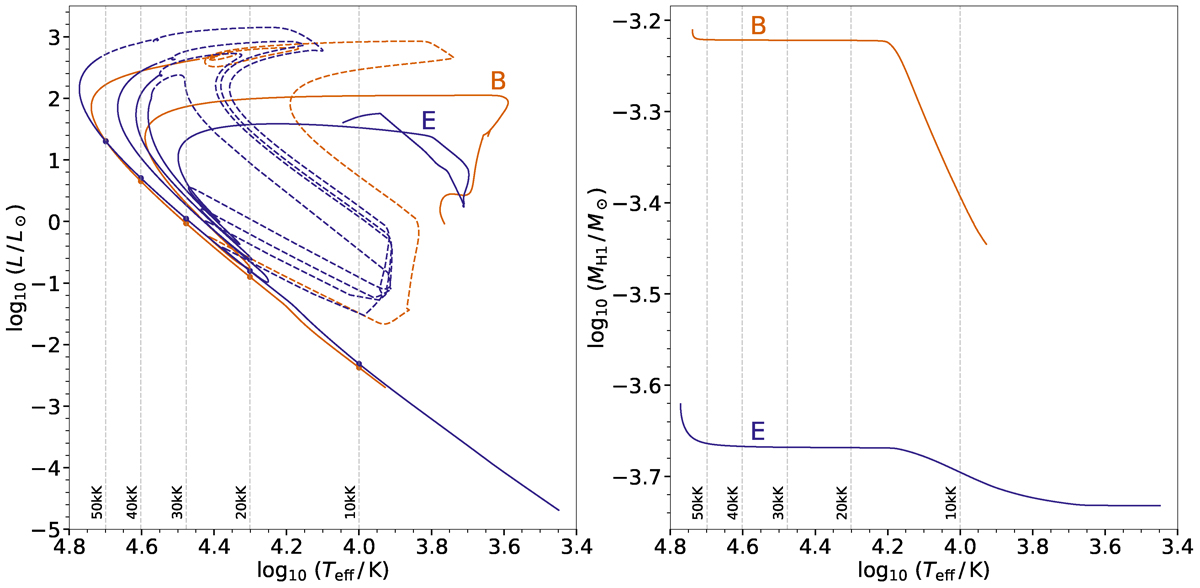
Fig. 3.
Download original image
Left panel: Hertzsprung-Russell diagram of the two stars corresponding to PAIR-1, which have the same luminosity at an effective temperature of 50 kK. The dots correspond to 10, 20, 30, 40, and 50 kK. Dashed lines represent fast parts of the tracks (see main text). The model names (Table 1) are shown and are consistent in color with their corresponding curve in Figure 2. Right panel: Hydrogen mass vs. effective temperature for the same models.
Current usage metrics show cumulative count of Article Views (full-text article views including HTML views, PDF and ePub downloads, according to the available data) and Abstracts Views on Vision4Press platform.
Data correspond to usage on the plateform after 2015. The current usage metrics is available 48-96 hours after online publication and is updated daily on week days.
Initial download of the metrics may take a while.