Fig. 5.
Download original image
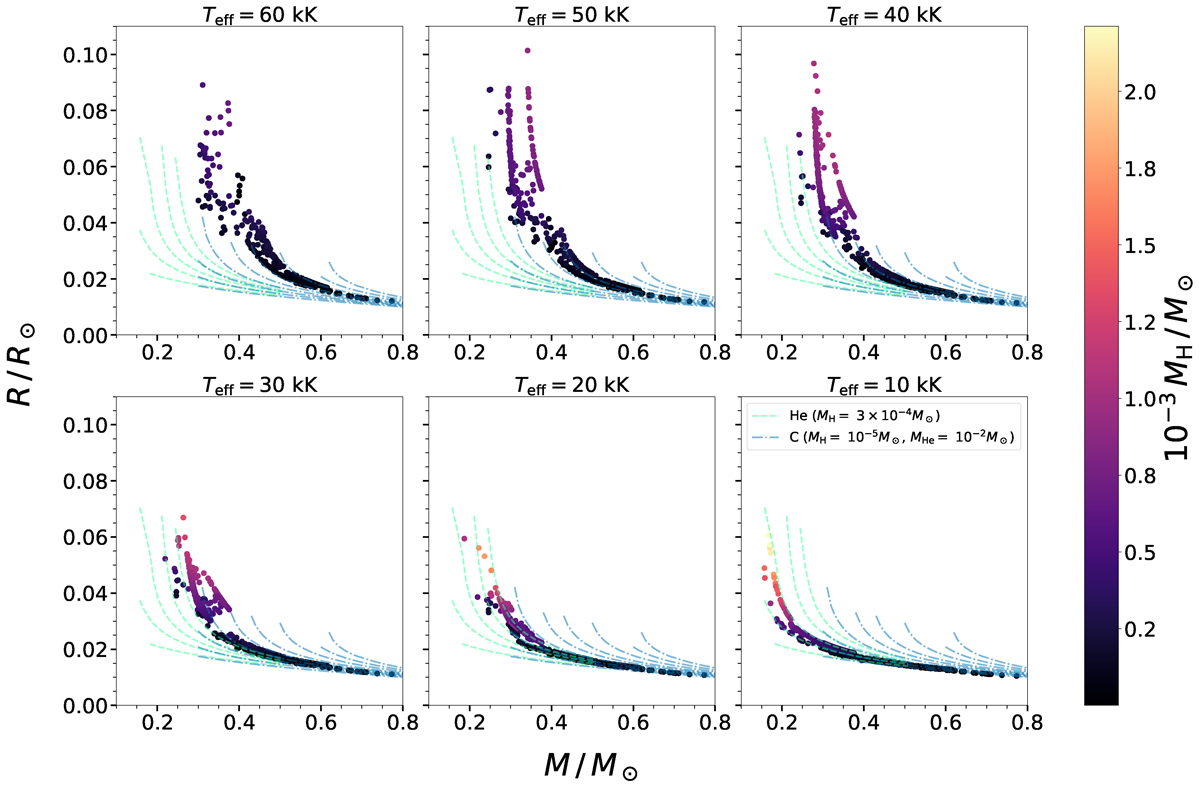
Color map of the hydrogen mass for the MRR obtained at different effective temperatures, from 10 kK to 60 kK. Theoretical curves from Panei et al. (2000) are plotted for comparison. The green (dashed) lines correspond to Helium WDs of (from left to right) 4.0, 8.0, 12.0, 16.0, and 20.0 kK with the same hydrogen layer. The light blue (point-dashed) lines correspond to carbon WDs of (from left to right) 5.0, 15.0, 25.0, 35.0, 45.0, 55.0, 70.0, 85.0, and 100.0 kK with the same hydrogen and helium layers.
Current usage metrics show cumulative count of Article Views (full-text article views including HTML views, PDF and ePub downloads, according to the available data) and Abstracts Views on Vision4Press platform.
Data correspond to usage on the plateform after 2015. The current usage metrics is available 48-96 hours after online publication and is updated daily on week days.
Initial download of the metrics may take a while.