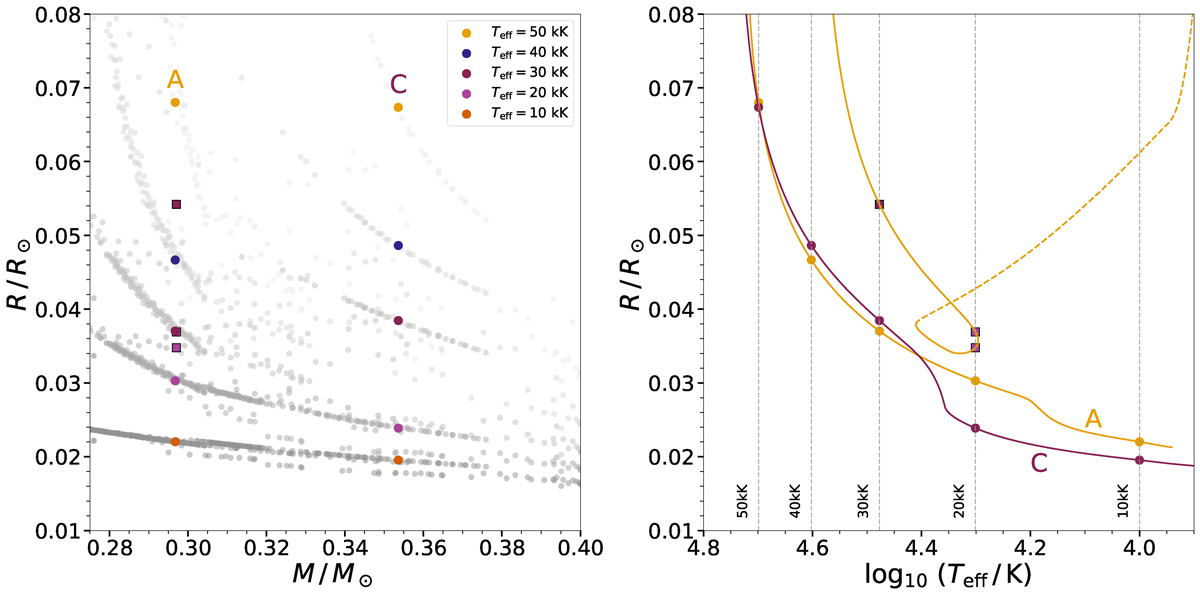
Fig. 6.
Download original image
Left panel: Mass-radius relation with PAIR-2 highlighted. The dots correspond to the mass and radius values given by our models at 10, 20, 30, 40, and 50 kK, while squares represent other possible values (at 20 and 30 kK) if the WD is not on the final cooling track. Right panel: Radius of the donor star as a function of the effective temperature for PAIR-2. Dashed lines represent fast parts of the tracks. The dots correspond to remnants on the final cooling track, while squares show other possible radii that could be observed for the same object at 20 and 30 kK.
Current usage metrics show cumulative count of Article Views (full-text article views including HTML views, PDF and ePub downloads, according to the available data) and Abstracts Views on Vision4Press platform.
Data correspond to usage on the plateform after 2015. The current usage metrics is available 48-96 hours after online publication and is updated daily on week days.
Initial download of the metrics may take a while.