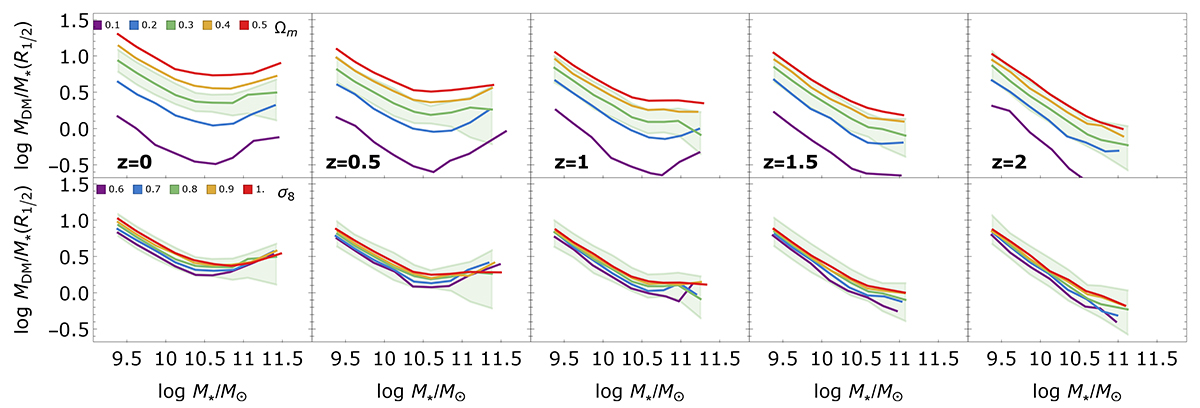
Fig. 1.
Download original image
MDM, 1/2/M⋆, 1/2 plotted against M⋆ for the CAMELS simulations. Each row shows variations in the cosmological parameters Ωm and σ8. The green lines represent the reference CAMELS simulation. To examine the evolution across redshift, simulation snapshots at z = 0, z = 0.5, z = 1, z = 1.5, and z = 2 are displayed from left to right. The medians in stellar mass bins are shown. For the reference simulation the 16-84th percentile range is also shown as a shaded green region.
Current usage metrics show cumulative count of Article Views (full-text article views including HTML views, PDF and ePub downloads, according to the available data) and Abstracts Views on Vision4Press platform.
Data correspond to usage on the plateform after 2015. The current usage metrics is available 48-96 hours after online publication and is updated daily on week days.
Initial download of the metrics may take a while.