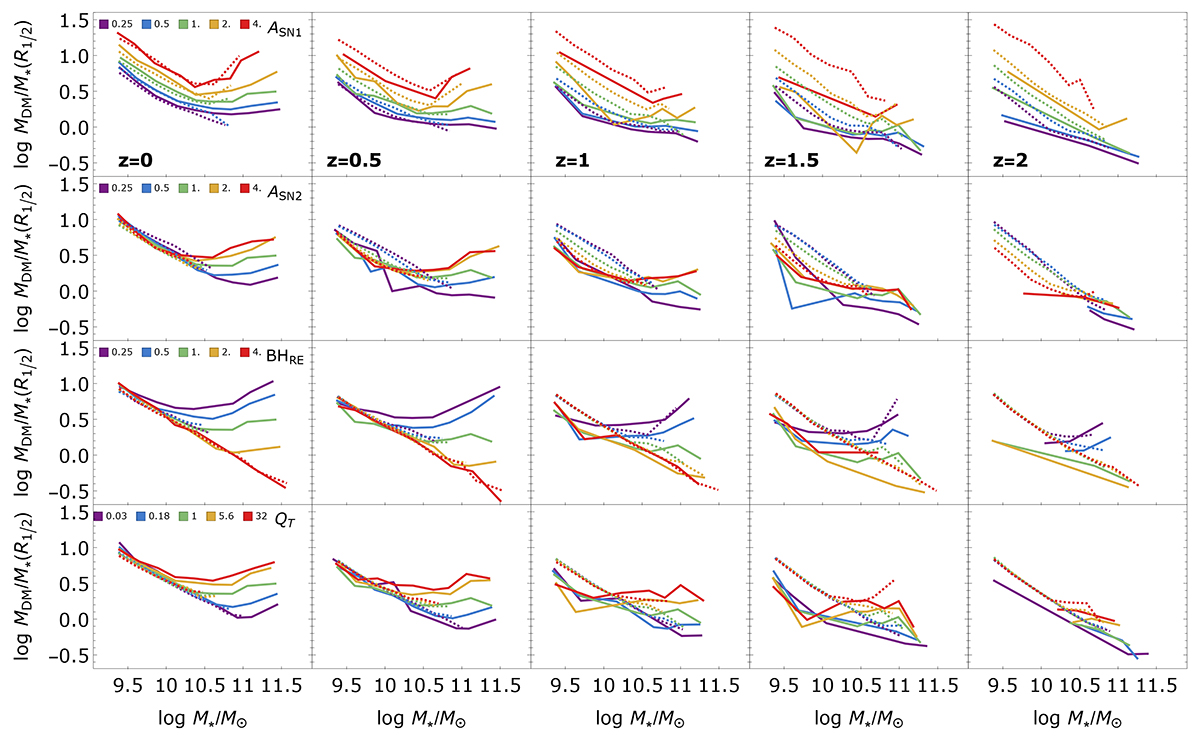
Fig. 5.
Download original image
MDM, 1/2/M⋆, 1/2 plotted against M⋆. The rows show variations in the two SN-related parameters ASN1 and ASN2 and the two AGN parameters BRE and QT. The green lines represent the reference CAMELS simulation. Simulation snapshots at z = 0, z = 0.5, z = 1, z = 1.5, and z = 2 are displayed from left to right. The sample is divided in PGs (solid lines) and SFGs (dashed lines). The medians in stellar mass bins are shown. The binning in the two subclasses has been optimized based on the number of points in the bin, and trends based on very few data points have been omitted.
Current usage metrics show cumulative count of Article Views (full-text article views including HTML views, PDF and ePub downloads, according to the available data) and Abstracts Views on Vision4Press platform.
Data correspond to usage on the plateform after 2015. The current usage metrics is available 48-96 hours after online publication and is updated daily on week days.
Initial download of the metrics may take a while.