Fig. 7.
Download original image
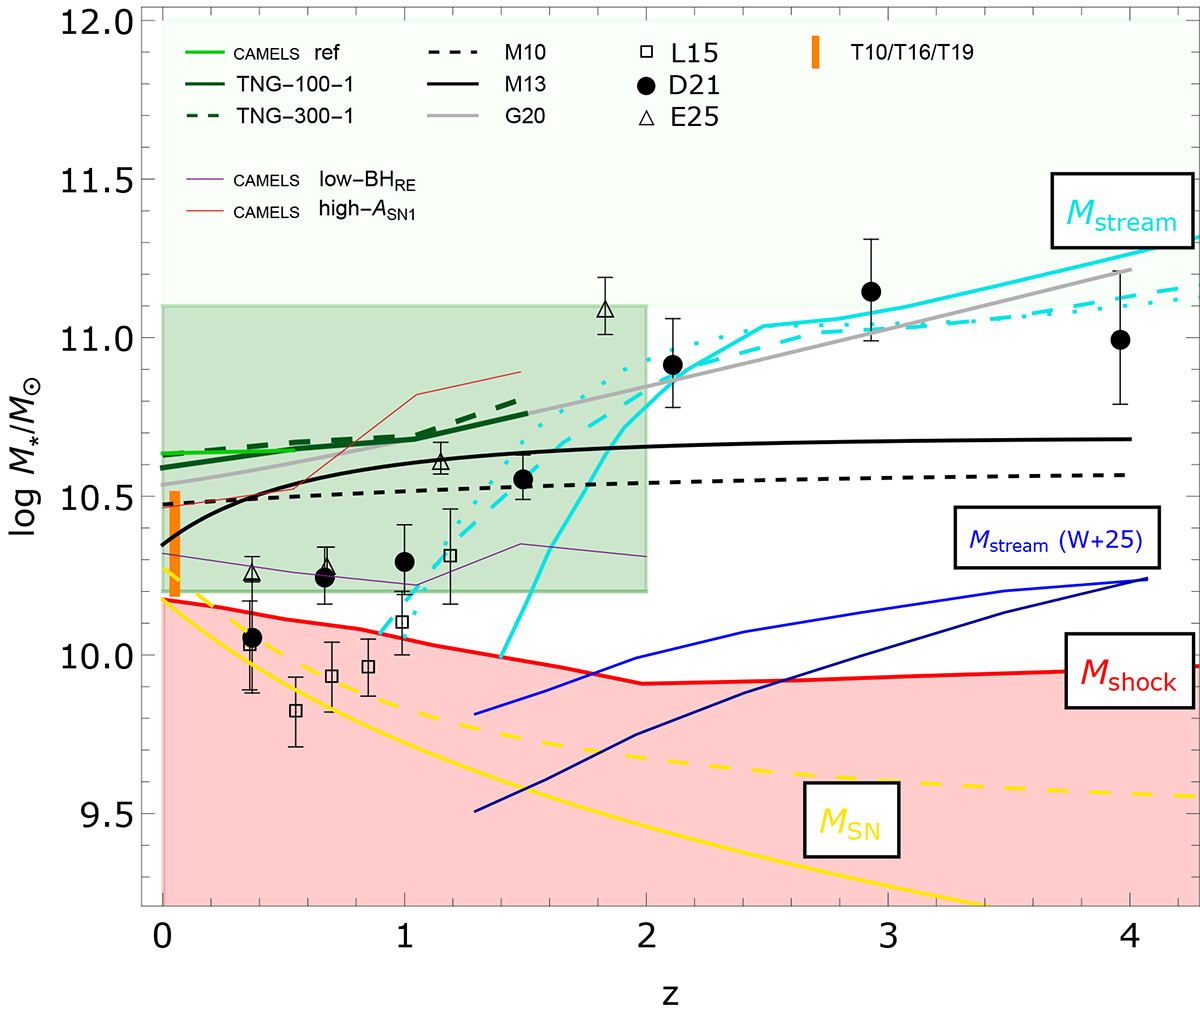
Golden mass determined from the central MDM/M⋆ − M⋆ relation assuming the reference CAMELS simulation (green line) is compared with other results from the literature. A qualitative range for the golden mass values determined from all the CAMELS simulations explored in this paper are shown as dark and light green regions (see text for more details). We also plot the results for the simulations corresponding to the lowest BHRE and highest ASN1 values. Then, we compare with the golden mass estimated from the same correlation for the TNG100-1 (dark green line) and TNG300-1 (dashed dark green line) simulations. From the theoretical point of view, we also show the shock heating stellar mass (Mshock) as a red line and the stream mass (Mstream) as solid cyan line (Dekel & Birnboim 2006), together with its two revised forms (dashed and dotted cyan lines) discussed in Daddi et al. (2022a). These curves for Mshock and Mstream are extracted from Daddi et al. (2022a), where more details can be found. The stream mass determined in Waterval et al. (2025) is also plotted as blue and dark blue lines (see details in the text). We show the typical mass above which SN feedback interrupts its quenching effect, using two conversions from halo to stellar mass (MSN, yellow lines; see text for details). From the observational point of view, we plot the range of golden masses in the local Universe from different observables (Tortora et al. 2010, 2016, 2019). Then, we also plot the stellar mass value of the bending in the SHMR determined from using halo-abundance matching in Moster et al. (2010, black dashed line), Moster et al. (2013, black solid line) and Girelli et al. (2020, grey solid line), and the bending mass in the main sequence of star-forming galaxies (Lee et al. 2015; Delvecchio et al. 2021; Euclid Collaboration: Enia et al. 2025).
Current usage metrics show cumulative count of Article Views (full-text article views including HTML views, PDF and ePub downloads, according to the available data) and Abstracts Views on Vision4Press platform.
Data correspond to usage on the plateform after 2015. The current usage metrics is available 48-96 hours after online publication and is updated daily on week days.
Initial download of the metrics may take a while.