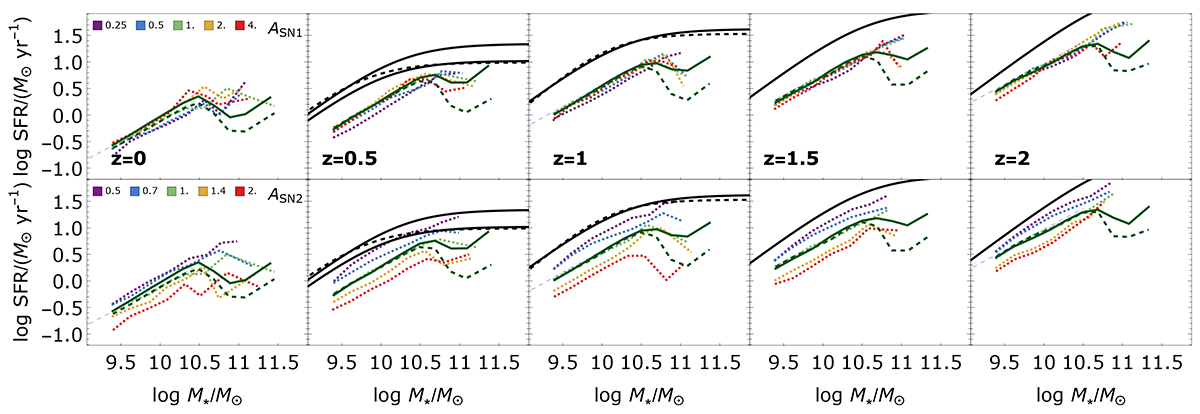
Fig. A.1.
Download original image
Star-forming main sequence in the CAMELS simulations as a function of ASN1 (top panels) and ASN2 (bottom panels). To illustrate the redshift evolution, we present simulation snapshots at z = 0, z = 0.5, z = 1, z = 1.5, and z = 2, displayed from left to right. In each panel, we show the median SFR in stellar mass bins. We compare the CAMELS results with those from the larger-volume TNG100-1 (solid dark green) and TNG300-1 (dashed dark green) simulations (Nelson et al. 2019b). The thin dashed blue line represents the best-fit to the main sequence in the stellar mass range log(M⋆/M⊙) = 9–10.5, as derived in Donnari et al. (2019) using TNG300-1. We also include observational results from Delvecchio et al. (2021, solid black line) and Lee et al. (2015, dashed black line) in contiguous redshift bins (extracted from Table 1 in Daddi et al. 2022a).
Current usage metrics show cumulative count of Article Views (full-text article views including HTML views, PDF and ePub downloads, according to the available data) and Abstracts Views on Vision4Press platform.
Data correspond to usage on the plateform after 2015. The current usage metrics is available 48-96 hours after online publication and is updated daily on week days.
Initial download of the metrics may take a while.