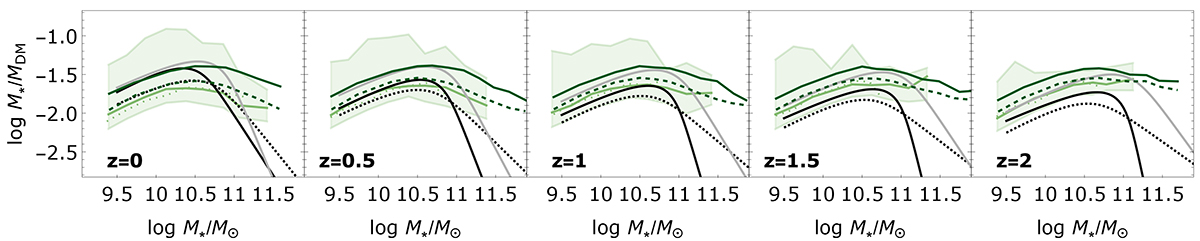
Fig. B.1.
Download original image
SHMR of the reference CAMELS simulation with a volume of (50 h−1 Mpc)3 showing the medians in stellar bins (solid green line) and the 16th–84th percentile range (shaded green region). To examine the evolution across redshift, simulation snapshots at z = 0, z = 0.5, z = 1, z = 1.5, and z = 2 are displayed from left to right. It is compared with the same simulation run in a smaller volume of (25 h−1 Mpc)3 (Villaescusa-Navarro et al. 2021, dotted green). We also show results from the TNG100-1 (dark green) and TNG300-1 (dark dashed green) simulations (Nelson et al. 2019b). For both CAMELS and TNG simulations, we plot the medians of the sample distribution divided in stellar mass bins. For comparison with semi-empirical models, we include abundance matching results from Moster et al. (2010, dashed black), Moster et al. (2013, solid black), and Girelli et al. (2020, Table 3, solid grey).
Current usage metrics show cumulative count of Article Views (full-text article views including HTML views, PDF and ePub downloads, according to the available data) and Abstracts Views on Vision4Press platform.
Data correspond to usage on the plateform after 2015. The current usage metrics is available 48-96 hours after online publication and is updated daily on week days.
Initial download of the metrics may take a while.