Fig. 13.
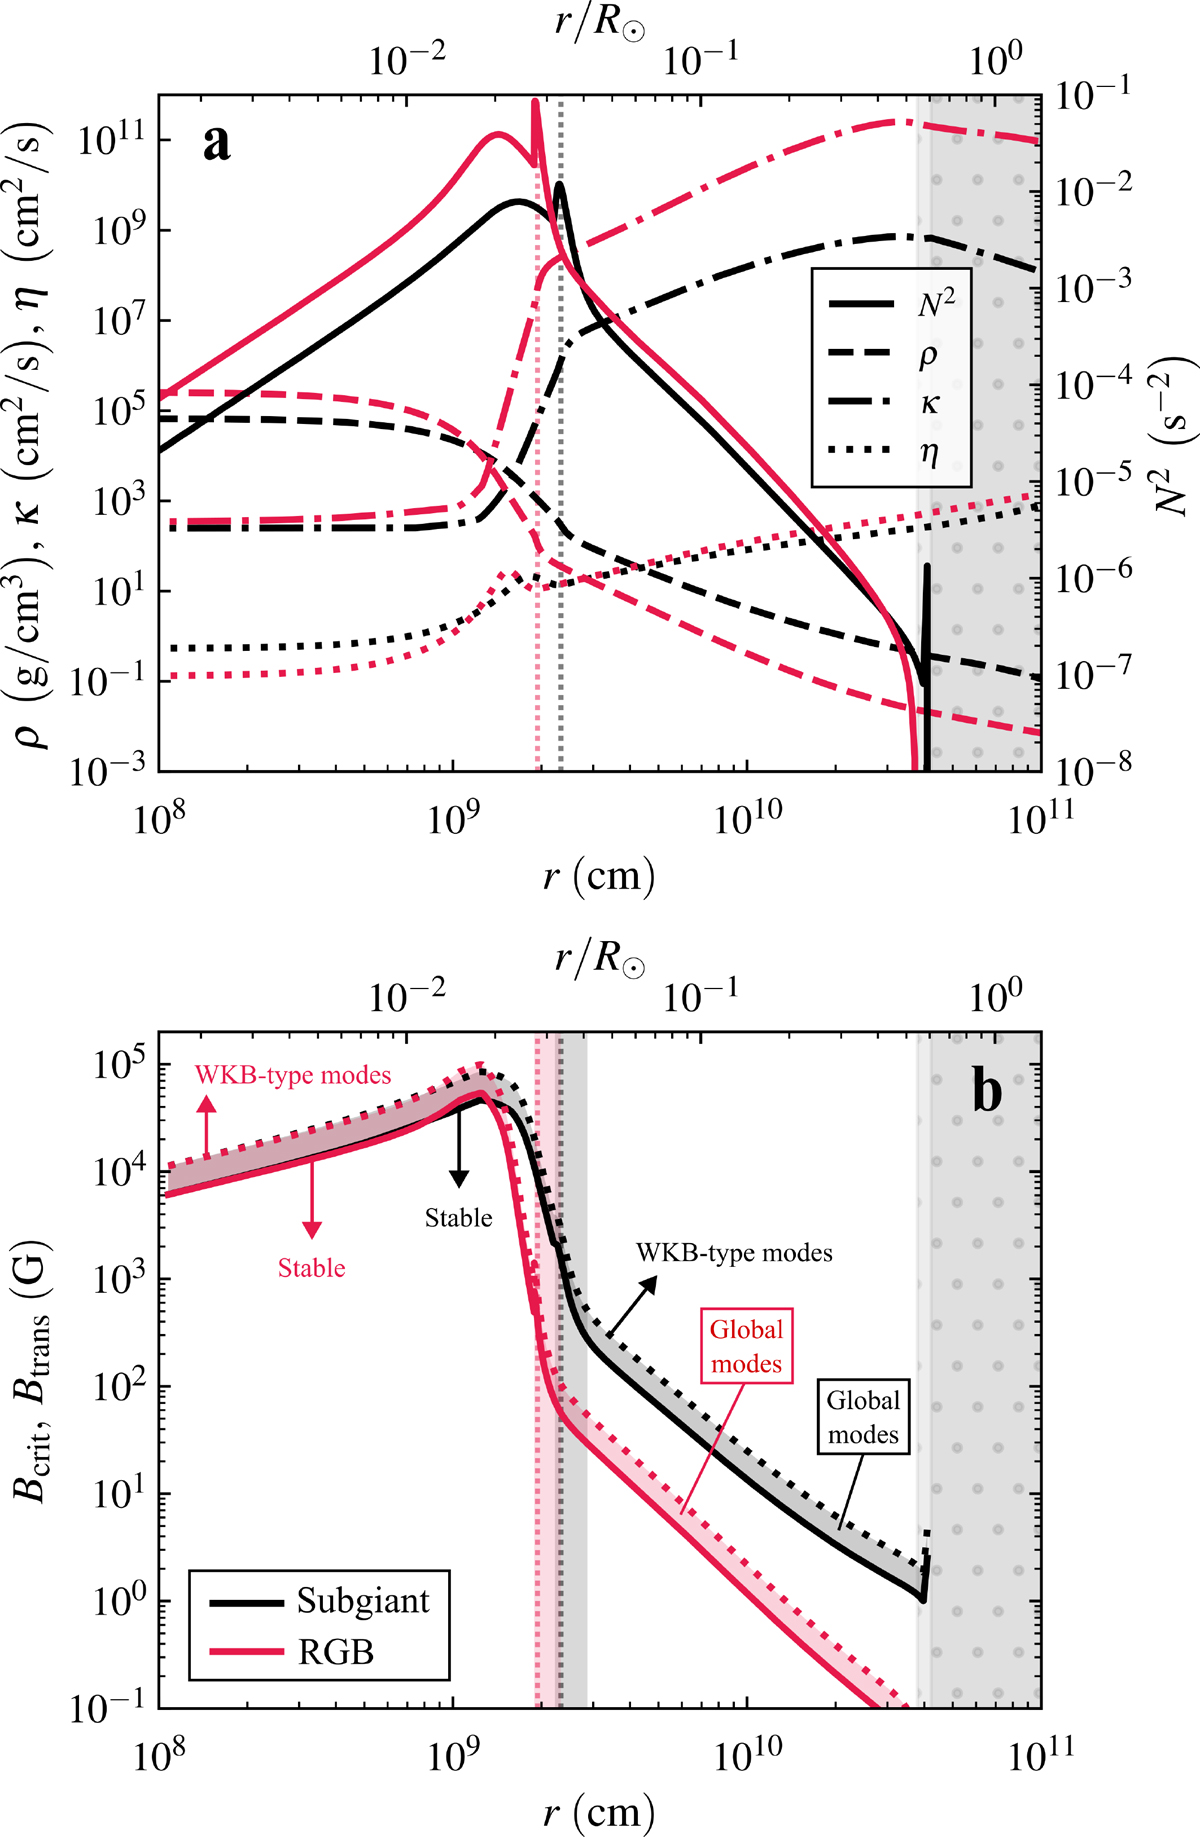
Download original image
Radial profiles of (a) key stellar quantities and (b) threshold toroidal field strengths for the 1.1 M⊙ stellar model at SG (black lines) and RGB (red lines) stages. The profiles span the radiative cores and the lower parts of the convective envelopes (vertical gray dot-hatched regions). Vertical dotted lines mark the approximate locations of the HBS. The upper horizontal axis shows the radius, r, in units of the solar radius, R⊙; the surface radii are 3.2 R⊙ (SG) and 16.1 R⊙ (red giant). Panel (a) displays the thermal contribution to the squared Brunt-Väisälä frequency (N2; right axis), along with the density, ρ, thermal diffusivity, κ, and magnetic diffusivity, η (left axis). Panel (b) shows the critical toroidal field strength for instability onset, Bcrit (solid lines) and the transition field strength, Btrans (dotted lines), which marks the boundary between the global and WKB-type instability regimes. The shaded regions between the two curves indicate the range of field strengths where global modes are expected. The vertical shaded region near the HBS of each star highlights the region where the chemical contribution to the Brunt-Väisälä frequency, Nμ, becomes significant compared to the thermal one, i.e., where |Nμ|> N/2.
Current usage metrics show cumulative count of Article Views (full-text article views including HTML views, PDF and ePub downloads, according to the available data) and Abstracts Views on Vision4Press platform.
Data correspond to usage on the plateform after 2015. The current usage metrics is available 48-96 hours after online publication and is updated daily on week days.
Initial download of the metrics may take a while.