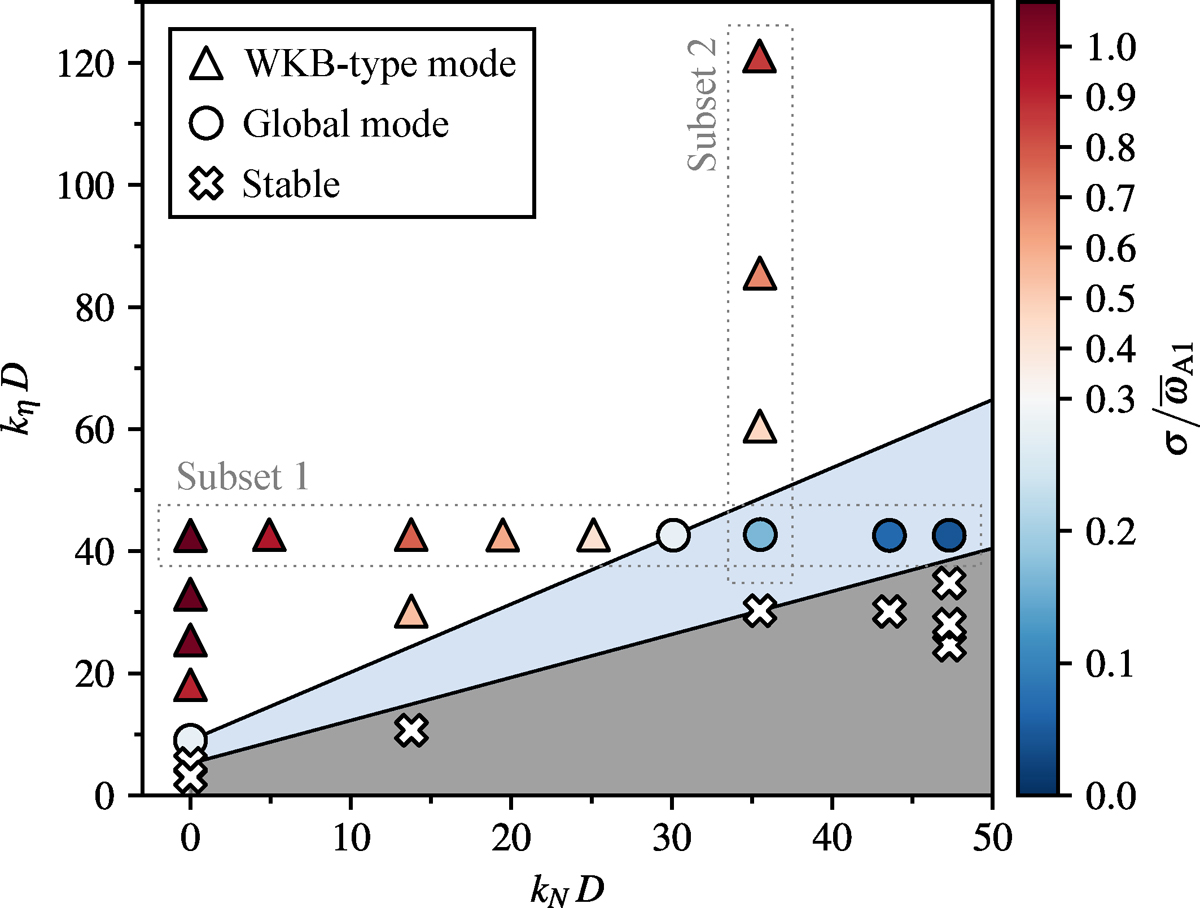
Fig. 9.
Download original image
Instability diagram showing the resistive wavenumber, kη, as a function of the stratification wavenumber, kN, both scaled by the shell gap, D. Individual simulation runs are represented by symbols: crosses indicate decaying nonaxisymmetric perturbations, while circles and triangles mark unstable global and WKB-type m = 1 modes, respectively. The symbol color codes the instability growth rate σ. The shaded gray and blue regions denote the stable regime and the global mode regime, respectively, based on the simulation data. The boundaries of these shaded regions are defined by Eq. (43) (stability line) and Eq. (44) (transition line between the global and WKB regimes). Thin dotted horizontal and vertical rectangles highlight runs in subset 1 (![]() ) and subset 2 (
) and subset 2 (![]() ).
).
Current usage metrics show cumulative count of Article Views (full-text article views including HTML views, PDF and ePub downloads, according to the available data) and Abstracts Views on Vision4Press platform.
Data correspond to usage on the plateform after 2015. The current usage metrics is available 48-96 hours after online publication and is updated daily on week days.
Initial download of the metrics may take a while.