Fig. 2.
Download original image
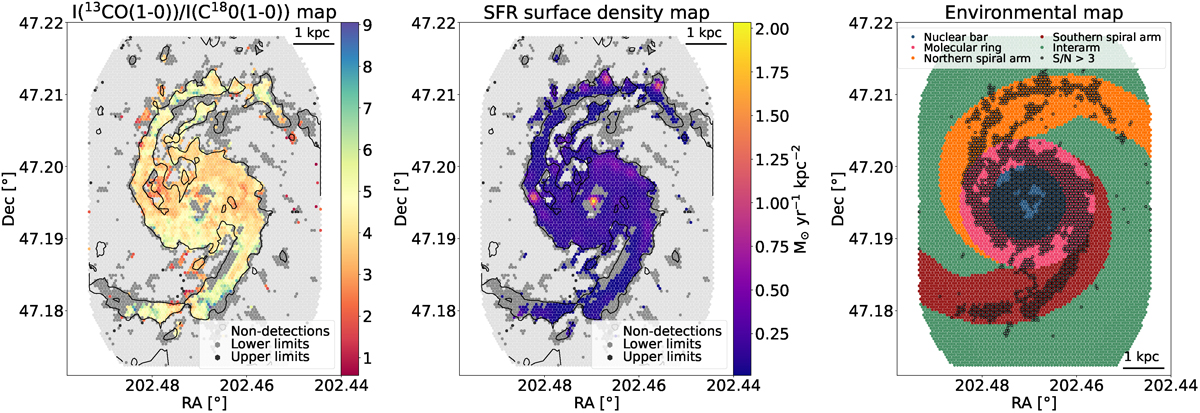
Complete dataset; the version masked for AGN activity and used in the analysis is provided in Appendix C. The left panel shows the ![]() line ratio map, while the central panel presents the ΣSFR map, limited to regions where the line ratio is significantly measured. In these maps, light grey points indicate non-detections (S/N ≤ 3 in both lines), intermediate grey denotes lower limits (S/N ≤ 3 in C18O), and dark grey indicates upper limits (S/N ≤ 3 in 13CO). Coloured points mark detections with S/N > 3 in both lines. The overlaid contours represent the 30 K km s−1 level of 12CO(1−0) emission for reference. The right panel shows the PAWS environmental mask (Colombo et al. 2014b) over the SWAN FoV, where different colours denote distinct environments: the nuclear bar (blue), molecular ring (pink), northern spiral arm (orange), southern spiral arm (red), and interarm (green). Points with black outlines correspond to the significant detections shown in the other panels.
line ratio map, while the central panel presents the ΣSFR map, limited to regions where the line ratio is significantly measured. In these maps, light grey points indicate non-detections (S/N ≤ 3 in both lines), intermediate grey denotes lower limits (S/N ≤ 3 in C18O), and dark grey indicates upper limits (S/N ≤ 3 in 13CO). Coloured points mark detections with S/N > 3 in both lines. The overlaid contours represent the 30 K km s−1 level of 12CO(1−0) emission for reference. The right panel shows the PAWS environmental mask (Colombo et al. 2014b) over the SWAN FoV, where different colours denote distinct environments: the nuclear bar (blue), molecular ring (pink), northern spiral arm (orange), southern spiral arm (red), and interarm (green). Points with black outlines correspond to the significant detections shown in the other panels.
Current usage metrics show cumulative count of Article Views (full-text article views including HTML views, PDF and ePub downloads, according to the available data) and Abstracts Views on Vision4Press platform.
Data correspond to usage on the plateform after 2015. The current usage metrics is available 48-96 hours after online publication and is updated daily on week days.
Initial download of the metrics may take a while.