Fig. 3.
Download original image
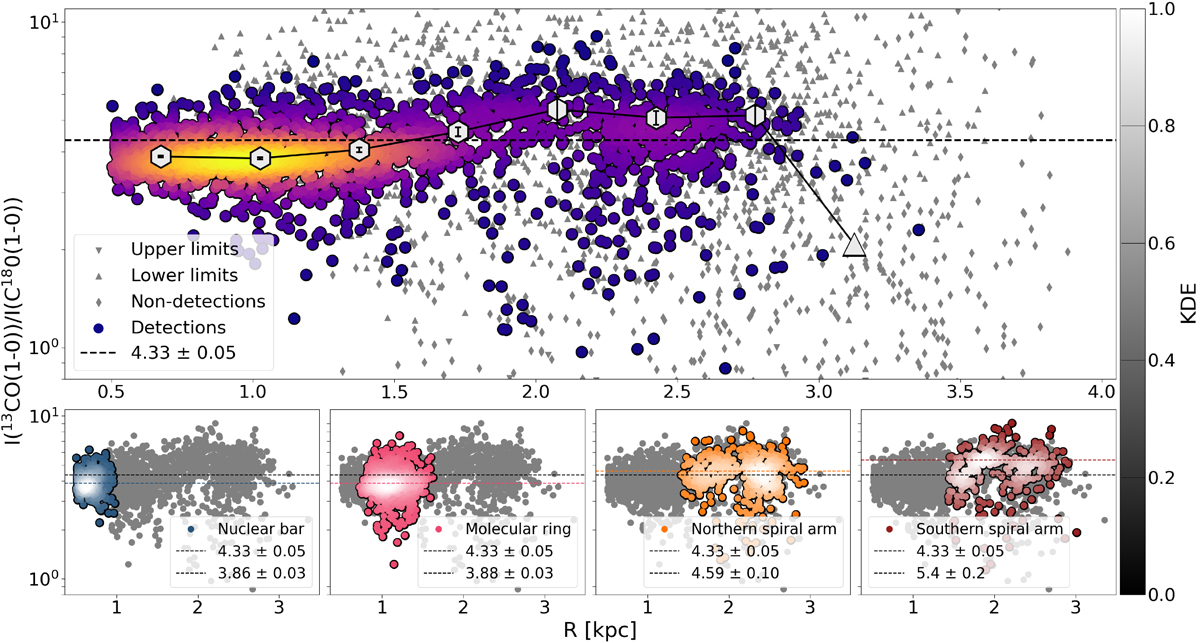
![]() plotted against galactocentric radius. In the top panel, coloured points represent sightlines where both emission lines have S/N > 3. Downward triangles denote lower limits, where the ratio has S/N ≤ 3 and C18O(1−0) also has S/N ≤ 3. Upward triangles indicate upper limits, where the ratio has S/N ≤ 3 and 13CO(1−0) also has S/N ≤ 3. Diamonds represent non-detections, where both lines have either S/N ≤ 3 or S/N > 3, but result in the ratio having S/N ≤ 3. White hexagons correspond to points obtained via spectral stacking, with the error bars corresponding to the propagated statistical uncertainties. The bottom panels highlight the points of each environment (see right map in Fig. 2), with grey points matching the coloured ones in the top panel and the coloured points highlighting the respective environment. The dashed black line marks the
plotted against galactocentric radius. In the top panel, coloured points represent sightlines where both emission lines have S/N > 3. Downward triangles denote lower limits, where the ratio has S/N ≤ 3 and C18O(1−0) also has S/N ≤ 3. Upward triangles indicate upper limits, where the ratio has S/N ≤ 3 and 13CO(1−0) also has S/N ≤ 3. Diamonds represent non-detections, where both lines have either S/N ≤ 3 or S/N > 3, but result in the ratio having S/N ≤ 3. White hexagons correspond to points obtained via spectral stacking, with the error bars corresponding to the propagated statistical uncertainties. The bottom panels highlight the points of each environment (see right map in Fig. 2), with grey points matching the coloured ones in the top panel and the coloured points highlighting the respective environment. The dashed black line marks the ![]() for the FoV, while the dashed coloured line indicates the
for the FoV, while the dashed coloured line indicates the ![]() for the specific environment. The colour saturation for points in both the top and bottom panels reflects the kernel density estimate.
for the specific environment. The colour saturation for points in both the top and bottom panels reflects the kernel density estimate.
Current usage metrics show cumulative count of Article Views (full-text article views including HTML views, PDF and ePub downloads, according to the available data) and Abstracts Views on Vision4Press platform.
Data correspond to usage on the plateform after 2015. The current usage metrics is available 48-96 hours after online publication and is updated daily on week days.
Initial download of the metrics may take a while.