Open Access
Fig. 5.
Download original image
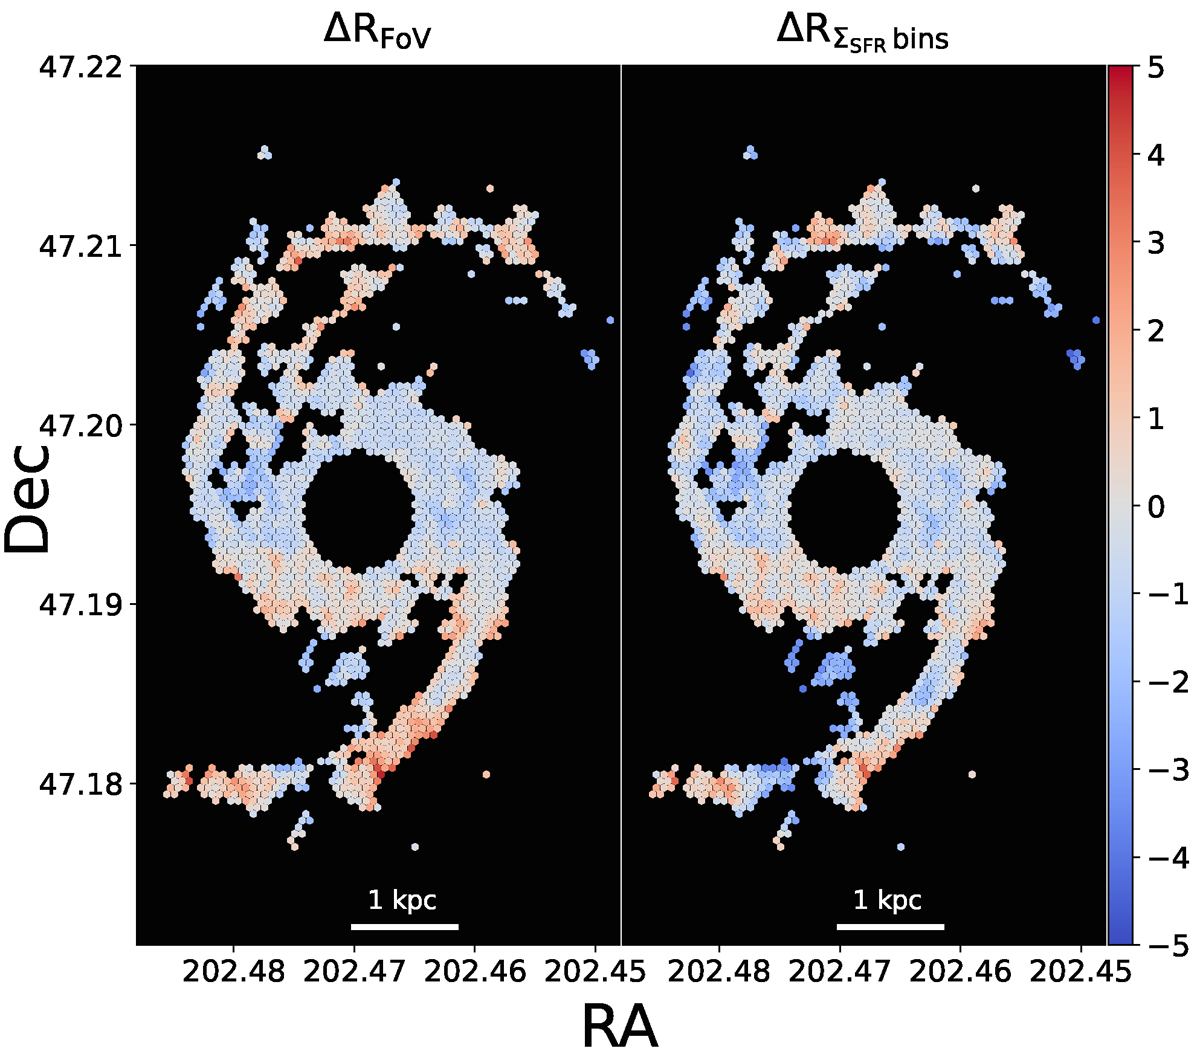
Deviations of significant (S/N > 3) points from the average trends. The left panel illustrates the deviation of significant data points from the ratio of medians for the entire FoV, while the right panels show how these significant points deviate from the stacked average within the corresponding ΣSFR bin for the full FoV.
Current usage metrics show cumulative count of Article Views (full-text article views including HTML views, PDF and ePub downloads, according to the available data) and Abstracts Views on Vision4Press platform.
Data correspond to usage on the plateform after 2015. The current usage metrics is available 48-96 hours after online publication and is updated daily on week days.
Initial download of the metrics may take a while.