Fig. 7
Download original image
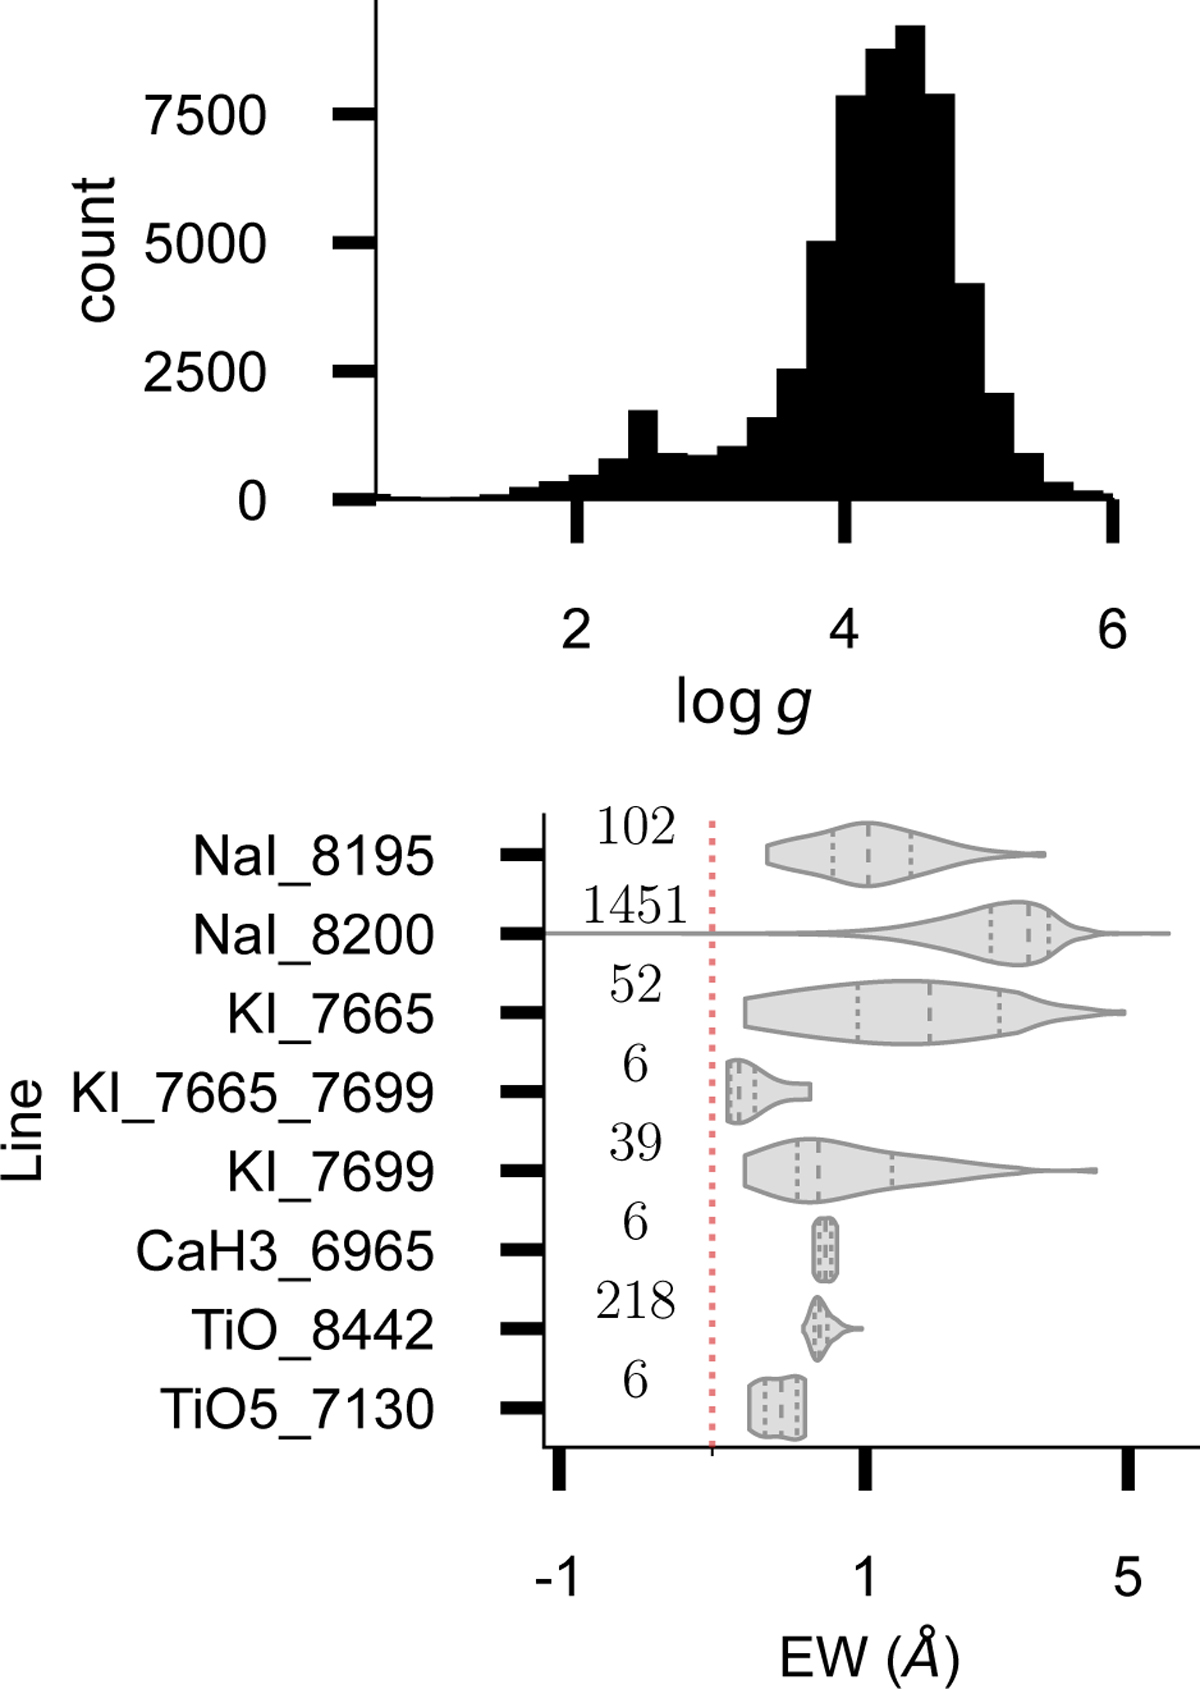
Top: distribution of log g values collated into the NEMESIS Catalogue of YSOs in the OSFC (Sect. 3.5). Bottom: general distribution of EW values for absorption lines collected as gravity proxy. The dotted red line reflects the continuum level. Violins are shown at a fixed width for improving visualisation. Violin’s internal dotted lines reflect distributions’ first and third quartiles, and dashed lines reflect their median.
Current usage metrics show cumulative count of Article Views (full-text article views including HTML views, PDF and ePub downloads, according to the available data) and Abstracts Views on Vision4Press platform.
Data correspond to usage on the plateform after 2015. The current usage metrics is available 48-96 hours after online publication and is updated daily on week days.
Initial download of the metrics may take a while.