Fig. 9
Download original image
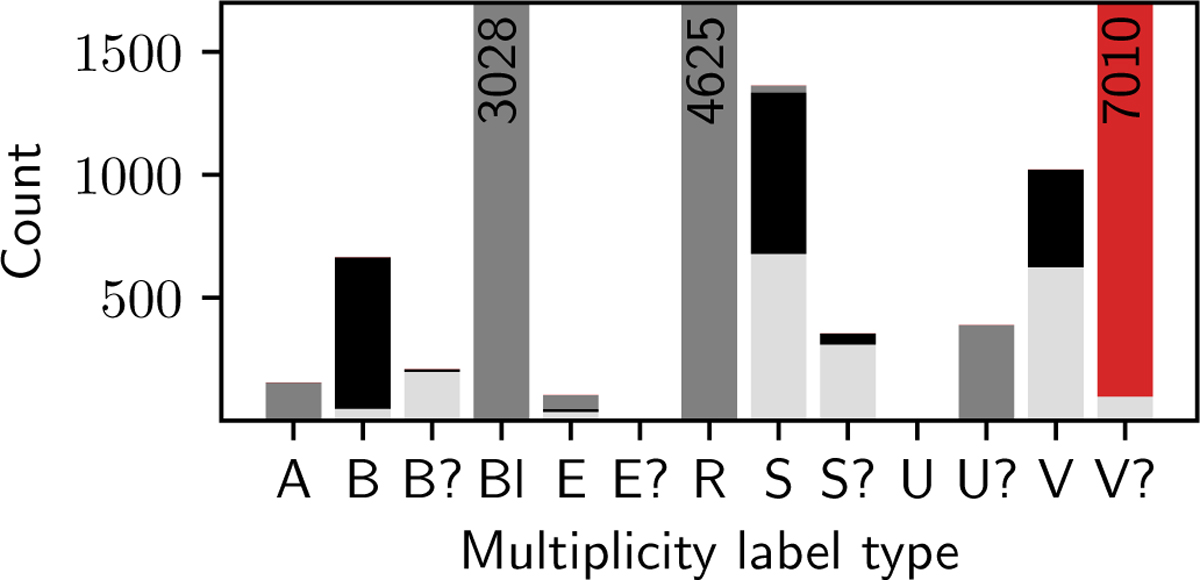
Incidence of different multiplicity labels included in the NEME-SIS Catalogue of YSOs in the OSFC. Light grey bars show labels collected as part of the historical compilation (Sect. 4.1), black bars show labels collected from binary-focussed catalogues (Sect. 4.2), dark gray bars show labels attributed using Gaia DR3 data (Sect. 4.4), and red bars show labels attributed using big data approaches (Sect. 4.3).
Current usage metrics show cumulative count of Article Views (full-text article views including HTML views, PDF and ePub downloads, according to the available data) and Abstracts Views on Vision4Press platform.
Data correspond to usage on the plateform after 2015. The current usage metrics is available 48-96 hours after online publication and is updated daily on week days.
Initial download of the metrics may take a while.