Fig. 10
Download original image
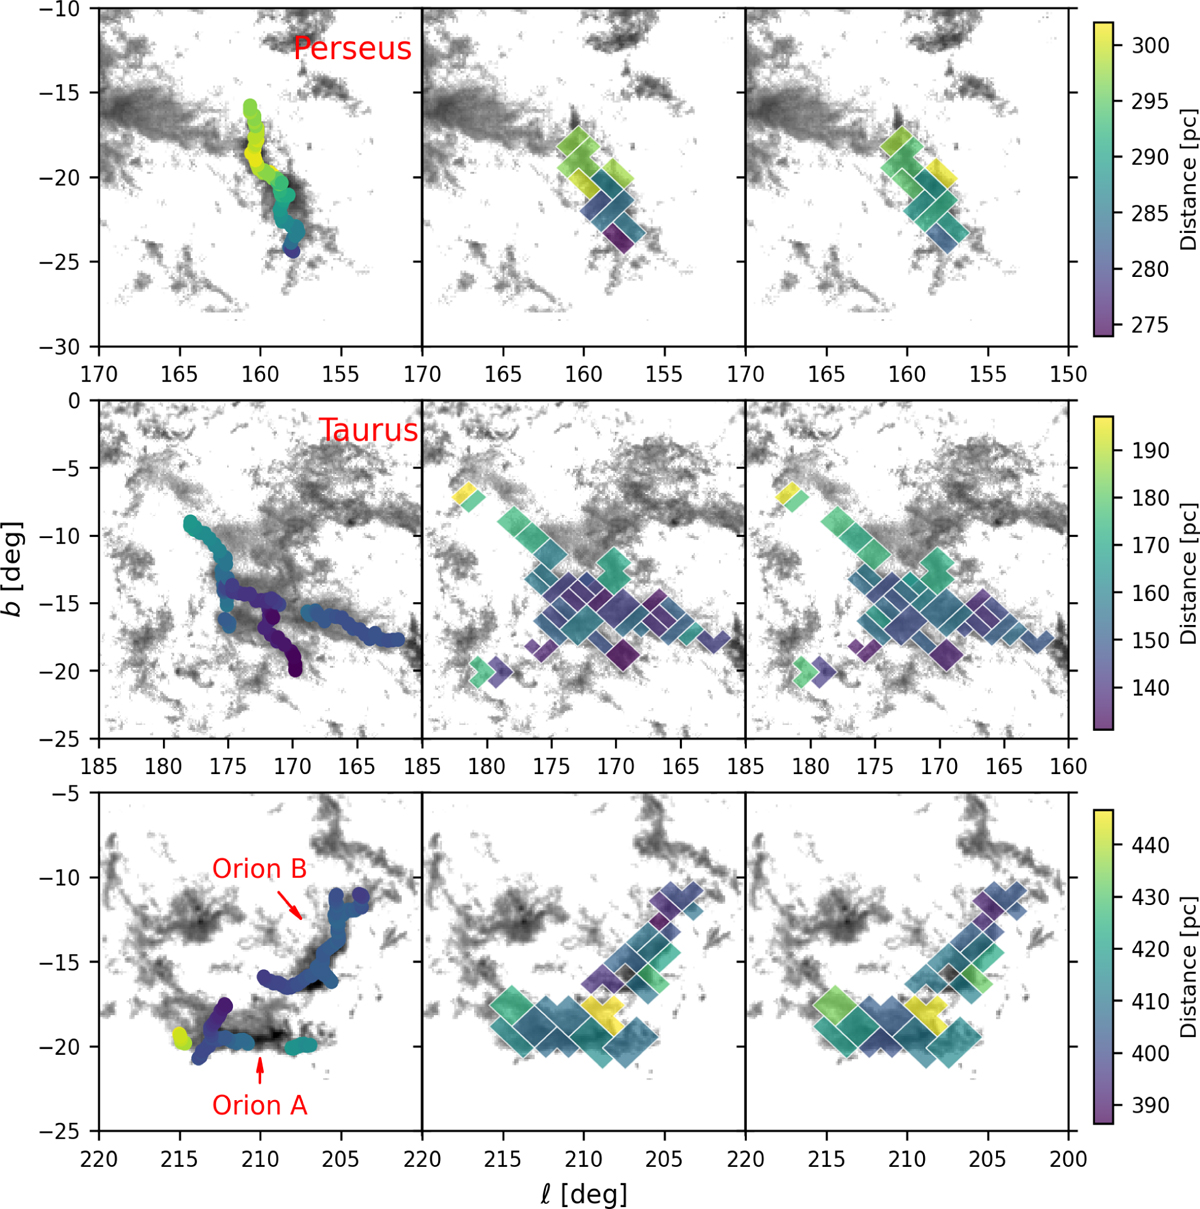
Comparison of distance measurements for the Perseus, Taurus, Orion A, and Orion B molecular clouds. Each row corresponds to a different region in Galactic coordinates (ℓ, b). The grayscale background in all panels represents WCO emission. The left panels show distances derived from Z21 extinction measurements, displayed as continuous color maps. The middle and right panels show pixelated distance measurements derived from EW6614 and E(BP–RP), respectively, with the color scale indicating distance. An interactive display of the specific pixel-based jumps, as shown in Fig. 8, is available at https://zenodo.org/records/15294371
Current usage metrics show cumulative count of Article Views (full-text article views including HTML views, PDF and ePub downloads, according to the available data) and Abstracts Views on Vision4Press platform.
Data correspond to usage on the plateform after 2015. The current usage metrics is available 48-96 hours after online publication and is updated daily on week days.
Initial download of the metrics may take a while.