Fig. 11
Download original image
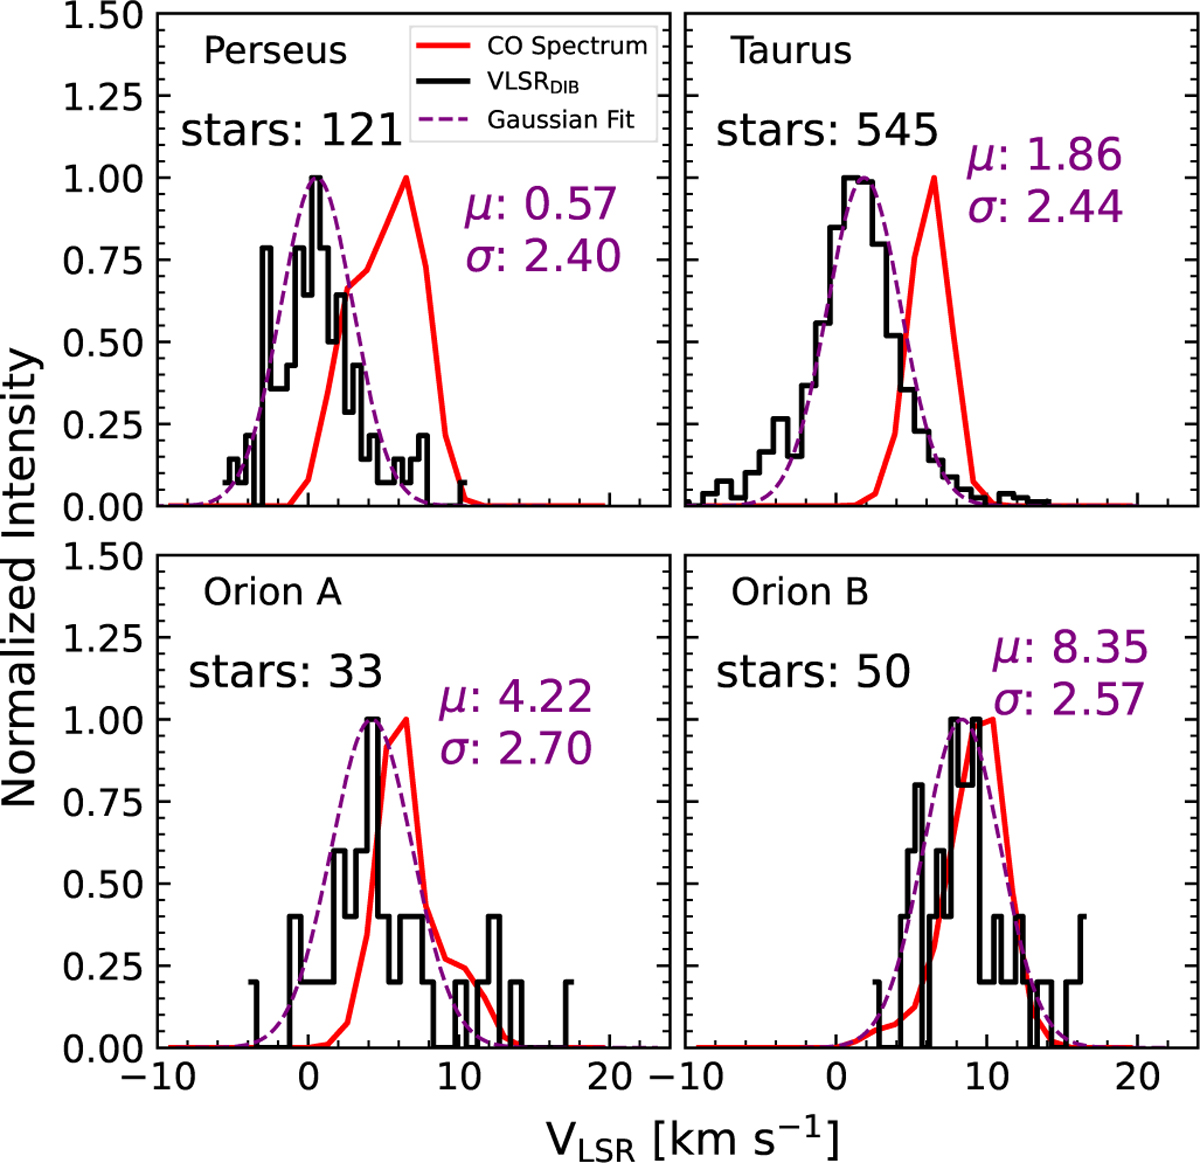
Comparison of VLSR for DIB λ6614 and 12CO spectra across four molecular cloud regions. The black stepped lines show the histogram of DIB 16614 velocities in the LSR frame, while the red lines represent the normalized12 CO spectra. The purple dashed lines show the Gaussian fits to the DIB 16614 velocity distributions for each cloud. The mean velocities (µ) and standard deviations (σ) are annotated in each panel. The number of stars used for each region is also indicated.
Current usage metrics show cumulative count of Article Views (full-text article views including HTML views, PDF and ePub downloads, according to the available data) and Abstracts Views on Vision4Press platform.
Data correspond to usage on the plateform after 2015. The current usage metrics is available 48-96 hours after online publication and is updated daily on week days.
Initial download of the metrics may take a while.