Fig. 12
Download original image
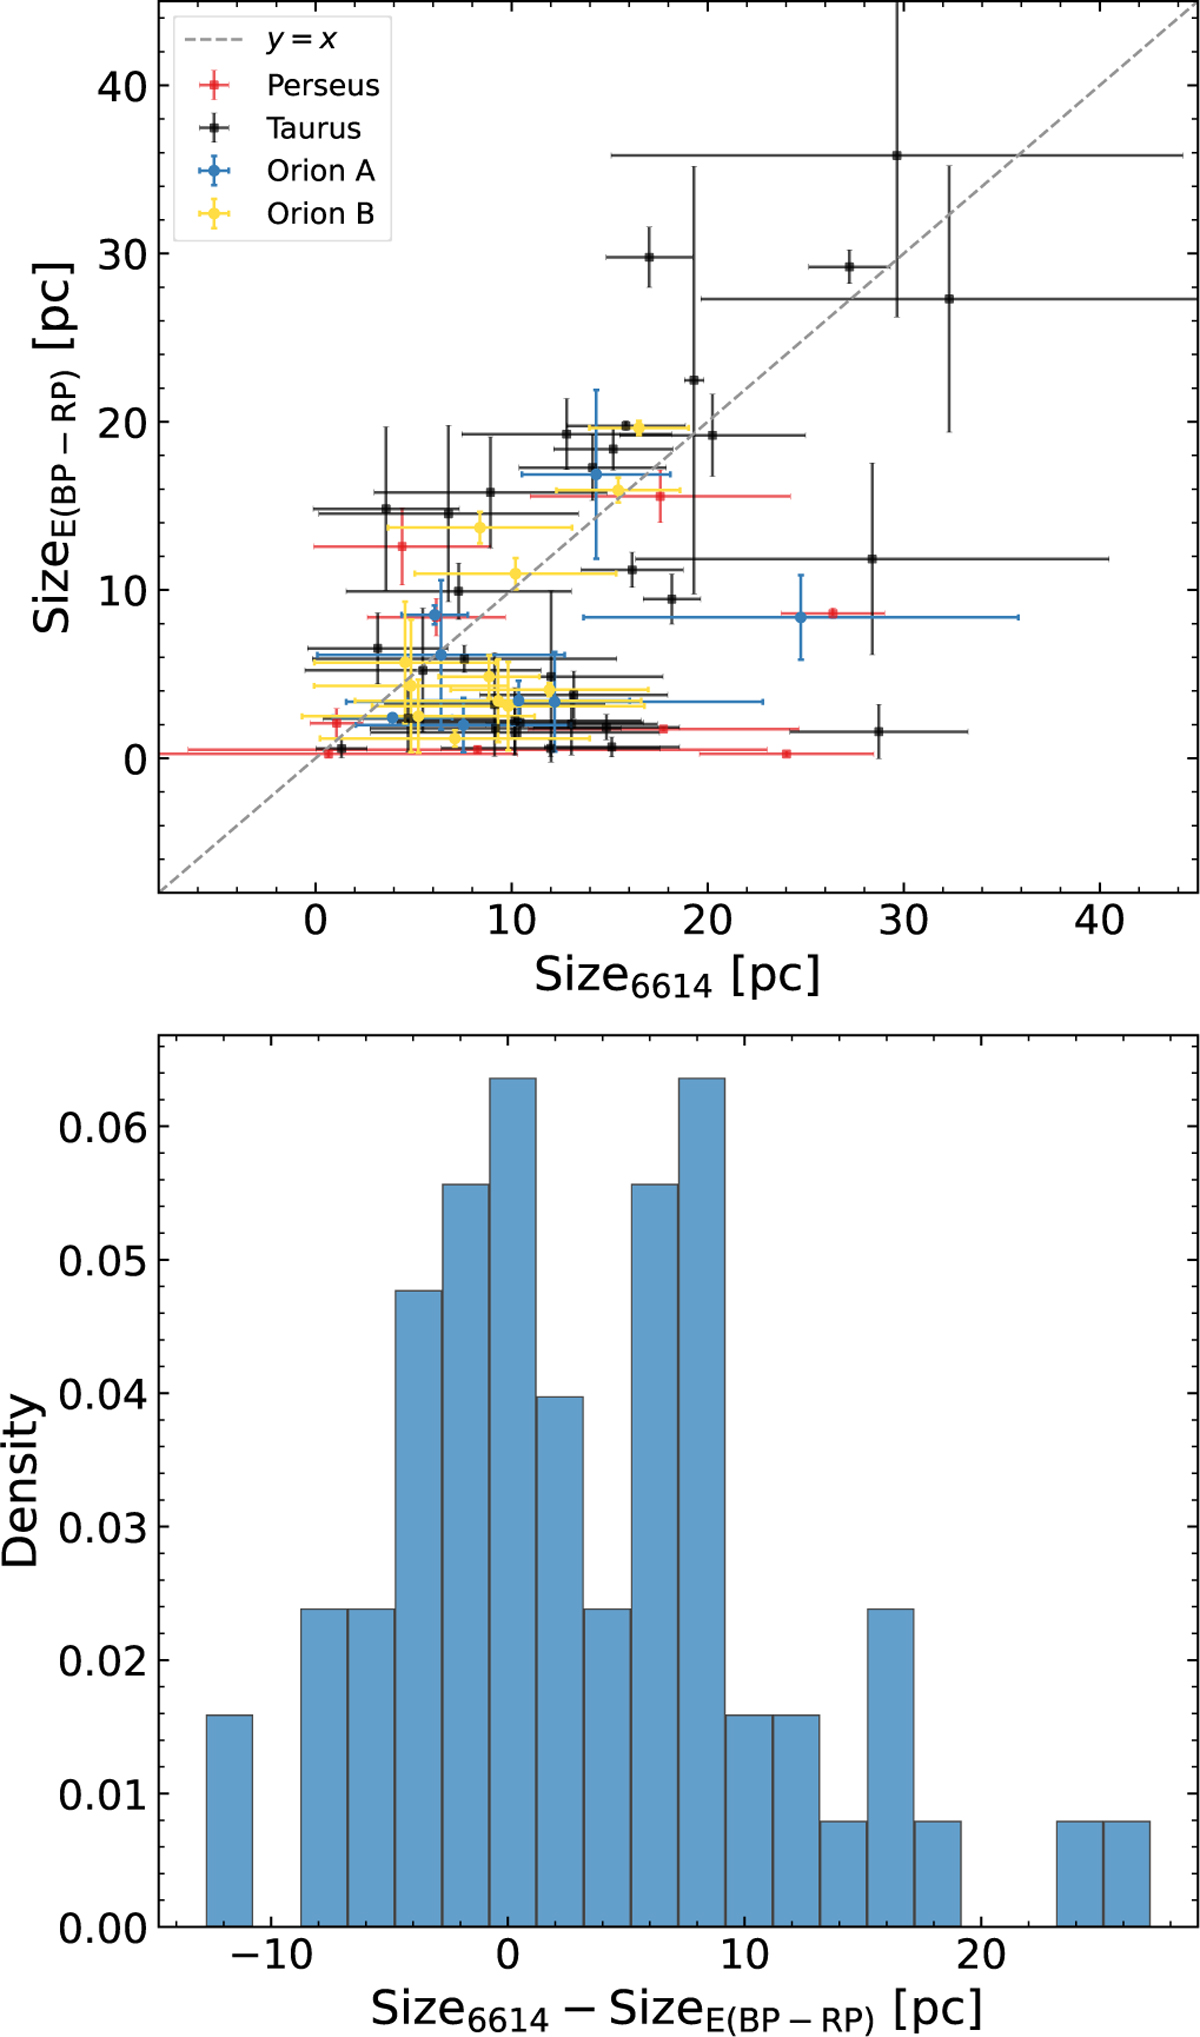
Comparison of the cloud sizes of sub-regions in the four molecular clouds as traced by DIB λ6614 and E(BP–RP). The upper panel presents the correlation between size estimates derived from DIB λ6614 and E(BP–RP), with error bars representing measurement uncertainties and colors indicating different molecular clouds. The gray dashed line marks the 1:1 relation. The lower panel shows the distribution of the differences between the two sets of size estimates.
Current usage metrics show cumulative count of Article Views (full-text article views including HTML views, PDF and ePub downloads, according to the available data) and Abstracts Views on Vision4Press platform.
Data correspond to usage on the plateform after 2015. The current usage metrics is available 48-96 hours after online publication and is updated daily on week days.
Initial download of the metrics may take a while.