Fig. 5
Download original image
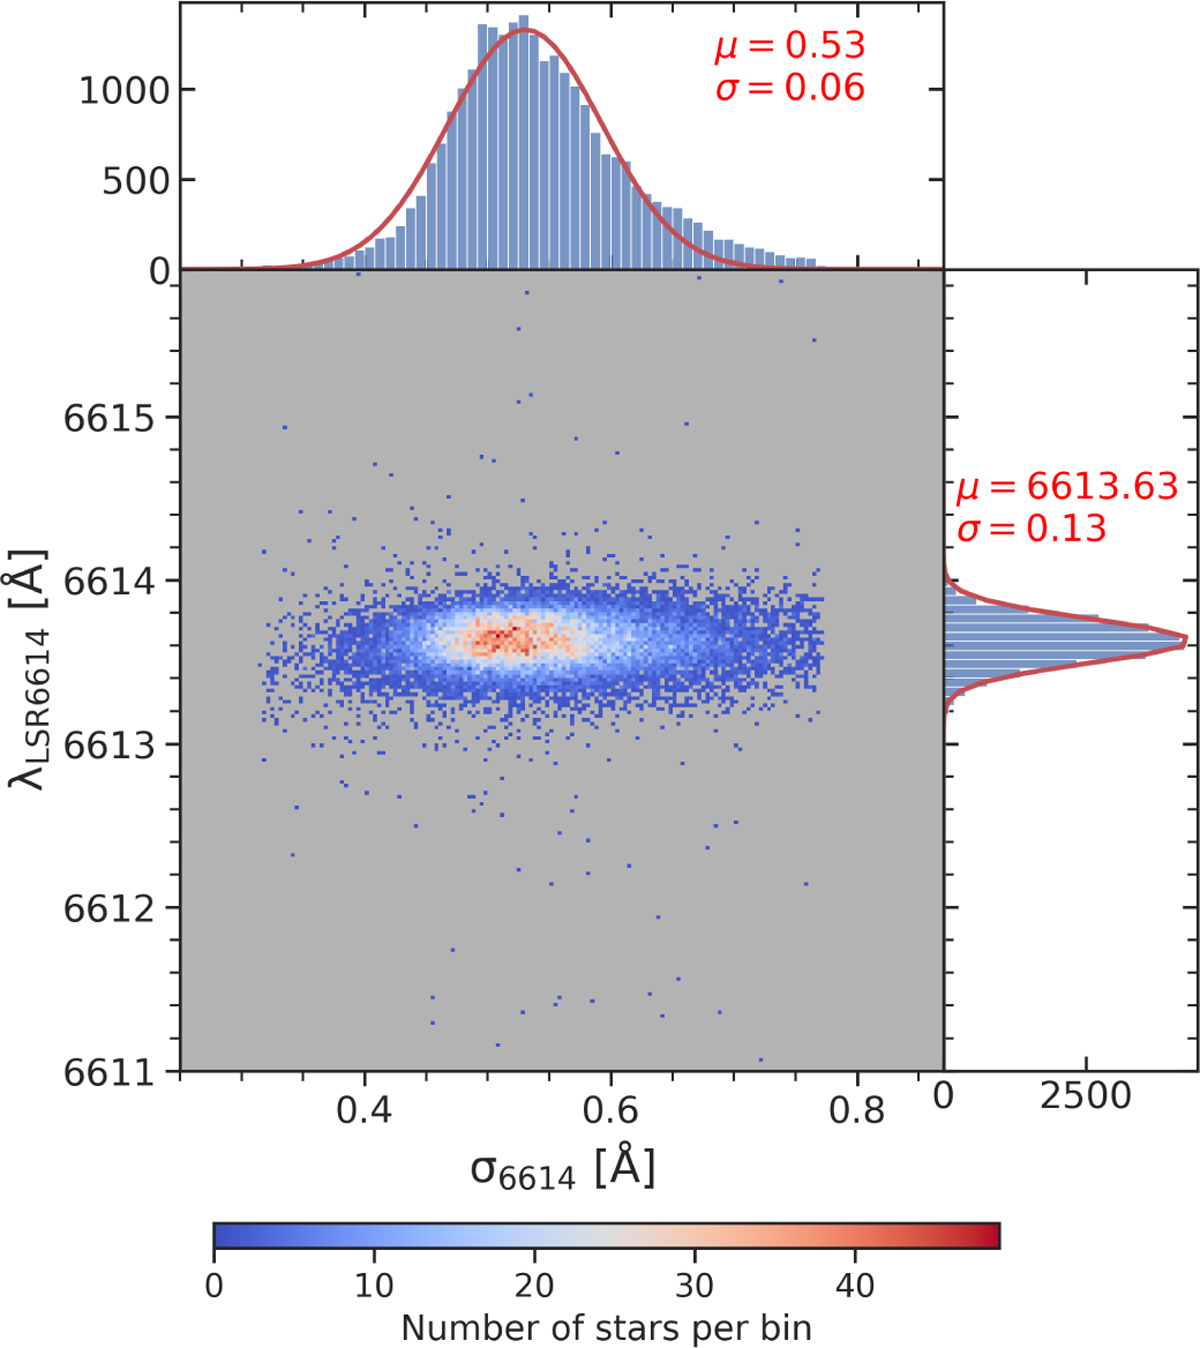
Distribution of λLSR6614 as a function of σ6614. The central panel shows a 2D histogram of λLSR6614 versus σ6614, with color intensity indicating the number of stars per bin. The top and right marginal histograms display the distributions of σ6614 and λLSR6614, respectively, with Gaussian fits overlaid in red. The corresponding mean (µ) and standard deviation (σ) are indicated in each panel.
Current usage metrics show cumulative count of Article Views (full-text article views including HTML views, PDF and ePub downloads, according to the available data) and Abstracts Views on Vision4Press platform.
Data correspond to usage on the plateform after 2015. The current usage metrics is available 48-96 hours after online publication and is updated daily on week days.
Initial download of the metrics may take a while.