Fig. 7
Download original image
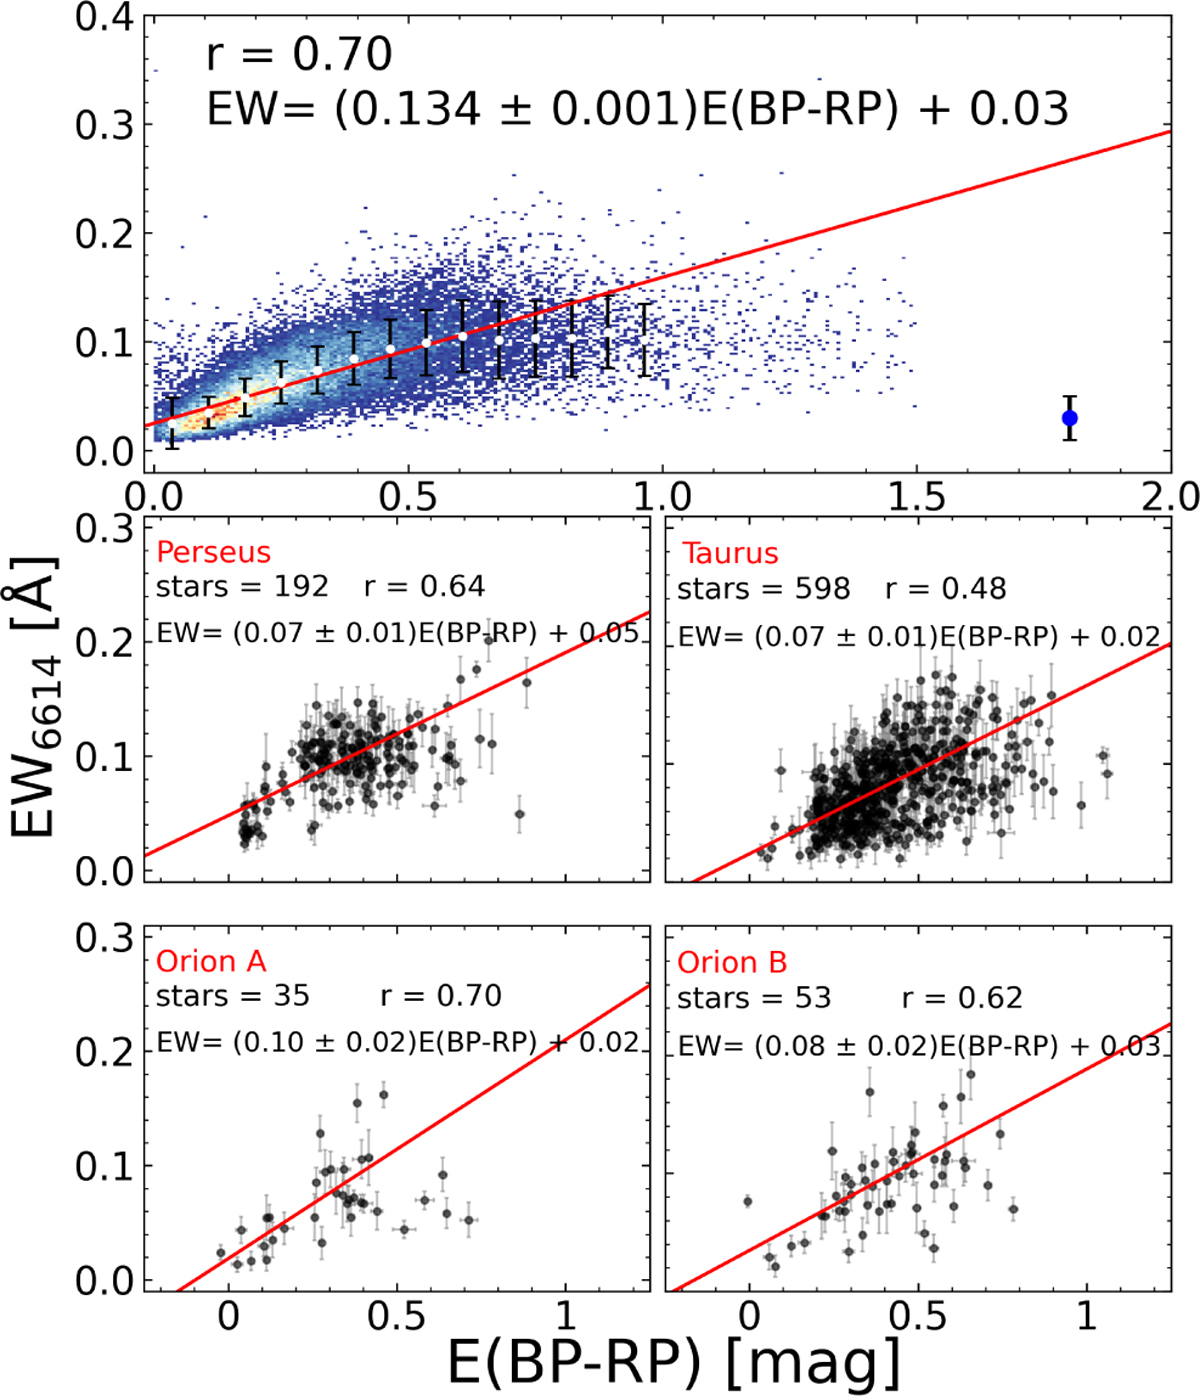
Correlation between EW6614 and E(BP-RP). The top panel shows all sources within 600 pc. The middle and bottom panels focus on four molecular clouds: Perseus, Taurus, Orion A, and Orion B. Each sub-panel displays the linear fit for the respective cloud, along with the Pearson correlation coefficient, slope, and number of stars. Error bars indicate the uncertainties in EW6614 and E(BP-RP). A typical EW6614 uncertainty of 0.02 Å, represented by the black error bar, is shown in the bottom right corner of the top panel.
Current usage metrics show cumulative count of Article Views (full-text article views including HTML views, PDF and ePub downloads, according to the available data) and Abstracts Views on Vision4Press platform.
Data correspond to usage on the plateform after 2015. The current usage metrics is available 48-96 hours after online publication and is updated daily on week days.
Initial download of the metrics may take a while.