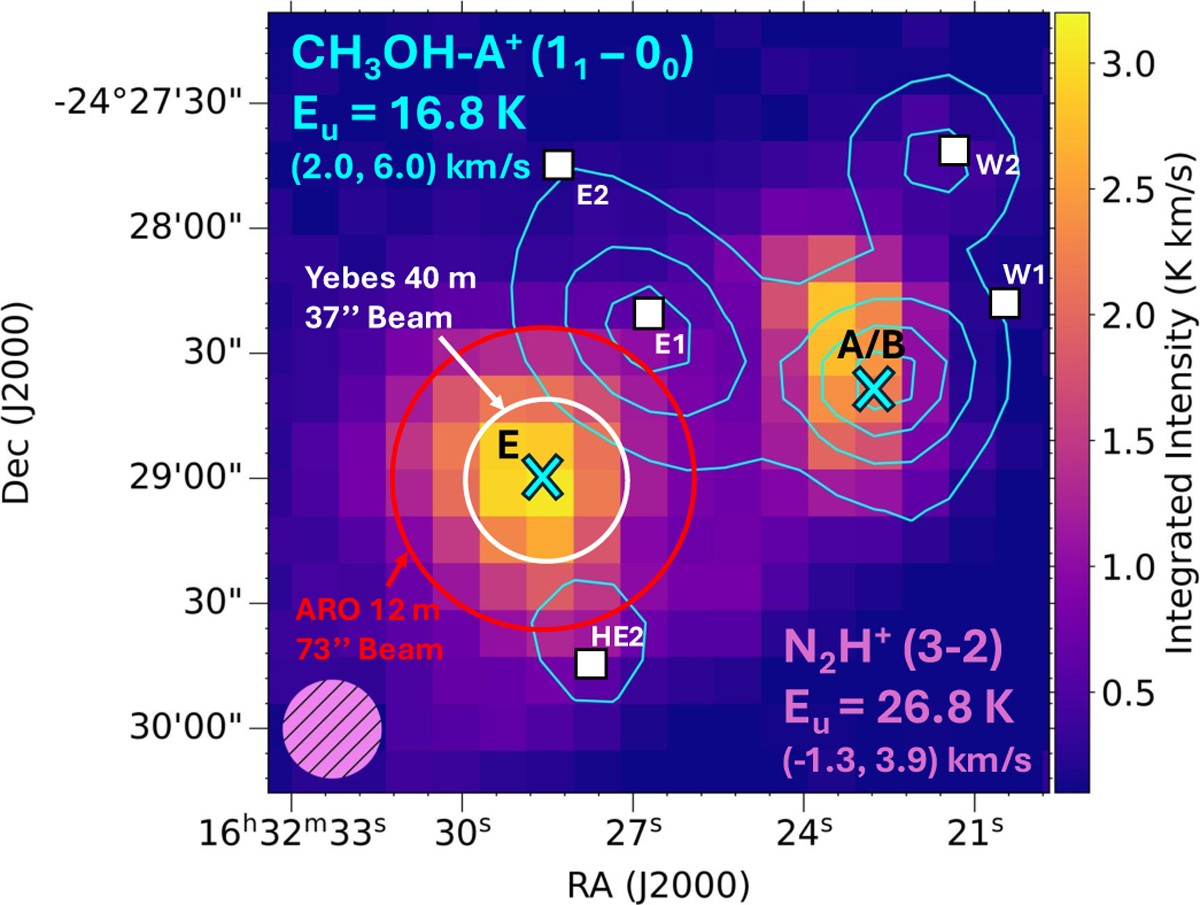
Fig. 1
Download original image
Map of the IRAS 16293-2422 region from publicly available APEX data presented by Kahle et al. 2023, where the color map is N2H+ (3-2) at 279.511 GHz, and the cyan contours show the CH3OH-A+ 11−00 b-type transition at 350.905 GHz (beam size for N2H+ is 23.7″ and shown in the bottom left corner). Crosses designate the locations of the IRAS 16293E prestellar core, labeled E, and the IRAS 16293A and B protostars labeled A/B. Other emission regions studied by Kahle et al. 2023 are labeled by white squares. For the single-pointing observations presented here, we also show the largest (ARO 12 m beam at 73″) and smallest beam size (Yebes 40 m beam at 37″).
Current usage metrics show cumulative count of Article Views (full-text article views including HTML views, PDF and ePub downloads, according to the available data) and Abstracts Views on Vision4Press platform.
Data correspond to usage on the plateform after 2015. The current usage metrics is available 48-96 hours after online publication and is updated daily on week days.
Initial download of the metrics may take a while.