| Issue |
A&A
Volume 702, October 2025
|
|
|---|---|---|
| Article Number | A127 | |
| Number of page(s) | 18 | |
| Section | Interstellar and circumstellar matter | |
| DOI | https://doi.org/10.1051/0004-6361/202553696 | |
| Published online | 14 October 2025 | |
Nascent chemical complexity in the prestellar core IRAS 16293E: Complex organics and deuterated methanol
1
National Radio Astronomy Observatory,
520 Edgemont Road,
Charlottesville,
VA
22903,
USA
2
Physikalisch-Meteorologisches Observatorium Davos und Weltstrahlungszentrum (PMOD/WRC),
Dorfstrasse 33,
7260
Davos Dorf,
Switzerland
3
Max-Planck-Institut für extraterrestrische Physik,
Giessenbachstrasse 1,
85748
Garching,
Germany
4
RIKEN Cluster for Pioneering Research,
Wako-shi,
Saitama
351-0106,
Japan
5
Center for Astrophysics | Harvard & Smithsonian,
60 Garden St.,
Cambridge,
MA
02138,
USA
6
Steward Observatory, University of Arizona,
933 North Cherry Avenue,
Tucson,
AZ
85721,
USA
★ Corresponding authors: This email address is being protected from spambots. You need JavaScript enabled to view it.
; This email address is being protected from spambots. You need JavaScript enabled to view it.
Received:
7
January
2025
Accepted:
4
August
2025
Abstract
Context. Prestellar cores represent early sites of low-mass (M ≤ few M⊙) star and planet formation and provide insight into the initial chemical conditions of complex organic molecules (COMs). Deuterated COMs trace the degree of molecular inheritance and/or reprocessing, as high deuteration in protostellar systems suggests COMs forming during the prestellar stage when deuteration was enhanced.
Aims. Within the L1689N molecular cloud, the prestellar core IRAS 16293E sits 90" eastward of the chemically rich IRAS 162932422 A and B protostellar system. A unique view of star formation inside a common natal cloud, IRAS 16293A, B, and E all show some of the highest levels of deuteration in the interstellar medium, with a number of D/H ratios 105 times higher than solar. We investigated the deuteration levels of the simplest COM, methanol (CH3OH), in IRAS 16293E for the first time.
Methods. Using the Arizona Radio Observatory (ARO) 12 m telescope, we targeted favorable transitions of CH2DOH, CHD2OH, 13CH3OH, and several higher-complexity COMs (including acetaldehyde, CH3CHO, methyl formate, HCOOCH3, and dimethyl ether, CH3OCH3) in the 3 mm band. Follow-up observations with the Yebes 40 m telescope provided additional transitions in the 7 mm (Q band).
Results. We report the first detections of these COMs and deuterated methanol in the prestellar core IRAS 16293E and used our observations to calculate excitation temperatures, column densities, and relative abundance ratios. Striking similarities were found between relative molecular ratios and D/H values when we compared IRAS 16293E to the A and B protostars, in addition to to a heterogeneous sample of other prestellar cores, protostars, and comet 67P/Churyumov-Gerasimenko.
Conclusions. Our results support the idea that there is a limited amount of chemical reprocessing of COMs when prestellar cores collapse and heat up during the protostellar phase.
Key words: astrochemistry / stars: formation / ISM: molecules / submillimeter: ISM / ISM: individual objects: IRAS16293E
Jansky Fellow of the National Radio Astronomy Observatory.
© The Authors 2025
 Open Access article, published by EDP Sciences, under the terms of the Creative Commons Attribution License (https://creativecommons.org/licenses/by/4.0), which permits unrestricted use, distribution, and reproduction in any medium, provided the original work is properly cited.
This article is published in open access under the Subscribe to Open model. This email address is being protected from spambots. You need JavaScript enabled to view it. to support open access publication.
1 Introduction
Cold (~10 K) and dense (~105 cm−3) embryonic clumps of gas and dust, known as starless and in the case of dynamically evolved structures (e.g., Crapsi et al. 2005; Keto & Caselli 2008), prestellar cores, will collapse due to gravity and external pressure to form stars like our Sun (M < a few solar masses; Andre et al. 2000). The generic term ‘starless’ is replaced by ‘prestellar’ when the core presents evidence that it has overcome turbulence and thermal and magnetic pressure to eventually dynamically collapse due to gravity and external cloud pressure to form an infant star.
Interstellar complex organic molecules (COMs) contain carbon and at least six atoms (Herbst & van Dishoeck 2009). They have now been detected in the gas phase toward several starless and prestellar cores in various low-mass starforming regions (Bacmann et al. 2012; Vastel et al. 2014; Jiménez-Serra et al. 2016; Scibelli & Shirley 2020; Scibelli et al. 2021 ; Jiménez-Serra et al. 2021 ; Megías et al. 2023; Scibelli et al. 2024). COMs are thought to be key precursor species that help us understand the origins and evolution of organic chemistry, the basis for life on Earth (e.g., acetaldehyde, CH3CHO, is important for the formation of alanine and other amino acids from carbonaceous chondrites; Chimiak 2021).
Understanding the degree of inheritance and/or reprocessing of COMs from the prestellar to the star- and planet-forming stages is of great interest to the astrochemistry community. Similarities in observed COM abundances when normalized to methanol, CH3OH, which seems to survive the disk-formation process (Walsh et al. 2016; Booth et al. 2021; Evans et al. 2025), have been found when comparing prestellar sources to protostars and comets (e.g., Drozdovskaya et al. 2019; Scibelli et al. 2021, 2024). These similarities suggest that when stars and planets continue to form and evolve within their original envelope of molecular gas and dust, at least part of their chemical composition is determined by the inheritance of molecules from the preceding evolutionary stages. Thus, to understand the astrochemical origins of the composition of planetary systems, we must set constraints on the chemical evolution at the onset of cloud and star formation, that is, in cold starless and prestellar cores (see Öberg & Bergin 2021 and references therein).
Deuterated COMs (D-COMs), that is, COMs that contain deuterium, provide an exciting probe into the chemical history because the high deuteration levels in protostellar systems (e.g., IRAS 16293-2422 A and B with D/H - 2-8% and D2/D ~20%; J0rgensen et al. 2018; Drozdovskaya et al. 2022) compared to the elemental value in the interstellar medium (ISM; D/H ~10−5 ; Linsky et al. 2006) suggest that COMs form during a time of enhanced deuteration. In the cold (~10 K) prestellar core stage, deuterium fractionation is predominately efficient because deuterated molecules have lower zeropoint energies than molecules with hydrogen (Caselli et al. 2002; Crapsi et al. 2007). At these lower temperatures, CO (the main destroyer of  and H2D+; Brown & Millar 1989; Roberts et al. 2003; Caselli et al. 2003) will also freeze out or deplete onto the grains, allowing for this enhancement of deuterated molecules (Caselli 2002; Crapsi et al. 2005), including larger species such as doubly deuterated formaldehyde, D2CO (Bacmann et al. 2003). To date, in only a handful of prestellar cores were singly and doubly deuterated versions of the simplest COM methanol detected, however (e.g., H-MM1 and L694-2 with CH2DOH/CH3OH ~ 0.8-1.9% and CHD2OH/CH2DOH ~ 50-80%; Lin et al. 2023).
The prestellar core IRAS 16293E is located within the L1689N molecular cloud in the Rho Ophiuchi cloud at a distance of ~141 pc (Dzib et al. 2018). It is thought to have the highest deuteration levels among starless and prestellar cores, based on strong emission of triply deuterated ammonia, ND3 (Lis et al. 2016). Earlier observations also found large amounts of D2CO toward this core (Loinard et al. 2001), as well as toward several positions in the molecular cloud L1689N itself (Ceccarelli et al. 2002). Other deuterated species such as DCO+ (Wootten & Loren 1987), DCN (Kahle et al. 2023), NH2D (Shah & Wootten 2001), ND2H (Loinard et al. 2001; Lis et al. 2006; Gerin et al. 2006), H2D+(Stark et al. 2004; Caselli et al. 2008; Brünken et al. 2014), D2H+(Vastel et al. 2004; Pagani et al. 2024), N2D+ (Spezzano et al. 2025), and HDO (Stark et al. 2004) are also prevalent in the core and/or in the surrounding cloud.
IRAS 16293E sits 90" (12 700 au) to the east of its protostellar neighbors, IRAS 16293-2422 A and B (Stark et al. 2004). Early observations of the protostellar system revealed high abundances of singly deuterated methanol, CH2DOH, and also provided the first ISM detections of doubly deuterated methanol, CHD2 OH (Parise et al. 2002), and triply deuterated methanol, CD3 OH (Parise et al. 2004). More recently, the ALMA Protostellar Interferometric Line Survey (PILS) team have uncovered a rich inventory of even larger gas-phase COMs and associated D-COMs, including the simple sugar glycolaldehyde (Jørgensen et al. 2012, 2016).
Observations of simpler molecular gas tracers (e.g., CH3OH, SO, CS, and H13CO+) around the IRAS 16923-2422 protostars and IRAS 16293E show clear differences in spatial distribution, derived column densities, and temperatures. This reveals the diverse physical conditions in the cloud complex (Kahle et al. 2023). Furthermore, it is thought that the large-scale outflows that are driven by IRAS 16293-2422 A interact with IRAS 16293E. By the impinging outflows, gas-phase species may more readily be desorbed off the grains. Gas-phase methanol, CH3 OH, has already been robustly detected toward IRAS 16923E with Atacama Pathfinder EXperiment (APEX) observations (277-375 GHz) of higher upper energy (Eu ~ 1750 K) transitions (Kahle et al. 2023; Spezzano et al. 2025), yet so far no observations have been dedicated to detecting any other larger COMs or D-COMs.
IRAS 16293E is a unique core whose ice chemistry and gasphase chemistry are both being thoroughly investigated. The executed JWST Cycle 2 General Observer (GO) program 3222, titled “Cask-strength clouds: high percentage of methanol and HDO ices” (PI: M. N. Drozdovskaya) will probe the chemical composition of ices in the L1689N dark cloud that houses the prestellar core IRAS 16293E (Drozdovskaya et al., in prep.). We present an Arizona Radio Observatory (ARO) 12 m and Yebes 40 m COM emission line survey toward IRAS 16923 E and focus this study on reporting column density estimates for newly detected singly deuterated methanol (CH2DOH), doubly deuterated methanol (CHD2OH), the 13C-isotopologue of methanol (13CH3OH), in addition to the COMs acetaldehyde (CH3CHO), methyl formate (HCOOCH3), and dimethyl ether (CH3 OCH3). We also derive the column density of methanol from low-energy (Eu<20 K) transitions. In Section 2, we describe the observations and data reduction methods. In Section 3, we calculate the column densities and excitation temperatures. We then place our calculations in the context with other sources in Section 4, and we conclude in Section 5.
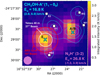 |
Fig. 1 Map of the IRAS 16293-2422 region from publicly available APEX data presented by Kahle et al. 2023, where the color map is N2H+ (3-2) at 279.511 GHz, and the cyan contours show the CH3OH-A+ 11−00 b-type transition at 350.905 GHz (beam size for N2H+ is 23.7″ and shown in the bottom left corner). Crosses designate the locations of the IRAS 16293E prestellar core, labeled E, and the IRAS 16293A and B protostars labeled A/B. Other emission regions studied by Kahle et al. 2023 are labeled by white squares. For the single-pointing observations presented here, we also show the largest (ARO 12 m beam at 73″) and smallest beam size (Yebes 40 m beam at 37″). |
2 Observations
We detail below our single-pointing observations with the ARO 12 m and Yebes 40 m telescopes taken toward the IRAS 16293E prestellar core in the L1689N molecular cloud. Beam sizes span from roughly 37″ to 73″ (5200 to 10 3000 au at the distance of Ophiuchus; see Figure 1 for scale).
2.1 ARO 12 m
Molecular line observations were obtained with the ARO 12 m radio dish on Kitt Peak outside of Tucson, Arizona. The data were collected from November 2023 to January 2024 with the 3 mm sideband-separating dual-polarization receiver. Each scan lasted for 5 minutes and used the standard absolute position switching (APS) observing mode between our sources, that is, the N2H+molecular emission peak position of IRAS 16293E (RA, DEC (J2000): 16h32m28.5s, −24°29′02.0″; Castets et al. 2001; Kahle et al. 2023), and the off-position without emission (RA: 16h32m33s, Dec: −24o25′00.0″) every 30 seconds. The pointing was checked every ~1-2 hours on the nearby planet Venus.
The AROWS spectrometer, with a spectral resolution of 39 kHz (0.12 km/s-0.14 km/s) and an automatic Hanning smoothing applied, was used for all observations with the two polarizations (vertical and horizontal). In setups 1 (local oscillator, LO, at 90GHz) and 2 (LO at 93.5 GHz), we were able to observe eight lines in parallel using the multiwindow mode, where each line was placed in a separate 250 MHz bandwidth spectral window, with groups of four within 4 GHz either in the lower side band (LSB) or in the upper side band (USB). In setup 3 (LO at 101 GHz), we were not able to use one of the AROWS boards, and only four lines could be tuned simultaneously in the LSB (see Table 1 for the parameters of the covered lines).
The initial reduction (i.e., combination of spectral scans) was performed using the CLASS program of the GILDAS package (Pety 2005,Gildas Team 2013)1. For each of the two polarizations, a median beam-efficiency percentage was calculated, along with estimated errors from median measurements of Venus. The two polarization measurements produced equivalent efficiencies, and thus, a single ηARO = 92.15 ± 2.74% was adopted. The spectra were then converted into the main-beam temperature using the equation  (Mangum 1993). This scaling and a Gaussian fitting of spectral lines was done with the Python Pyspeckit package (Ginsburg & Mirocha 2011 ; Ginsburg et al. 2022).
For simplicity, a single velocity component was assumed in the Gaussian fitting for each line of interest, even for CH3OH and CH3CHO, which clearly show multiple velocity components (Figures 2 and 3), likely because these species are more widespread and our large beam (~60″) picks up gas that is affected by interactions with the nearby protostellar outflows originating from the direction of the A/B protostars (Figure 1). Additionally, for HCOOCH3 we degraded the spectral resolution of the spectra by a factor of 3 to increase the signal-to-noise ratio for these weak lines. This led to more uncertainty in the line width and centroid velocity (Figure 3). All line fitting results are listed in Table 1, where the noise level or RMS is calculated by finding the standard deviation in the spectrum away from any line emission.
2.2 Yebes 40 m
The data from the dual (horizontal and vertical) linear polarization Q-band receiver (Tercero et al. 2021) on the Yebes 40 m telescope were taken during the spring (April to June) of 2024 (24A006: PI Scibelli). These observations were made in position-switching mode with the same off position as was used during the ARO 12 m observations. We note that while frequency-switching is also available, confusion from baseline ripples was a concern, as certain lines could be broader and confused due to the nearby outflow and multiple velocity components. The wide-band nature of the receiver allows for a total bandwidth of 18.5 GHz spanning 31.5-50 GHz (6-9 mm) with a resolution of 38.0 kHz (0.38-0.23 km/s).
The data were inspected, reduced, and placed on the main-beam temperature, Tmb, scale using publicly available Pythonbased scripts2 developed by Megías et al. (2023), which invokes the CLASS program of the GILDAS package to combine the spectra. The main-beam efficiencies measured and given by Yebes are 0.65(0.64) at 32.4 GHz, 0.61(0.61) at 34.5 GHz, 0.61(0.60) at 36.9 GHz, 0.59(0.58) at 39.2 GHz, 0.58(0.57) at 41.4 GHz, 0.56(0.55) at 43.7 GHz, 0.54(0.54) at 46.0 GHz, and 0.52(0.41) at 48.4 GHz for the horizontal (vertical) polarizations. As for the ARO 12 m spectra, the Gaussian fitting of spectral lines was done with the Python Pyspeckit package (Ginsburg & Mirocha 2011; Ginsburg et al. 2022), and the fitting results are listed in Table 1. In general, the σTMB values range over ~2-9 mK.
For this analysis, we only studied energetically favorable transitions (i.e., transitions with Eu < 25 K and Einstein Aul values >1.0 × 10⁻⁷ s−1) of the COMs and D-COMs already targeted with the ARO 12 m, which include CH3OH, CH2DOH, CH3CHO, HCOOCH3, CH3OCH3, and CH2CHCN (which remains undetected). These Yebes Q-band COM transitions (as well as a single ARO 12m setup that included the CH3OH 96.7 GHz, CH3CHO 95.9 GHz, and CH2CHCN 94-96 GHz transitions) were previously investigated toward starless and prestellar cores in the Perseus molecular cloud (Scibelli et al. 2024). While other lines are covered in our band, they will be presented in a subsequent paper.
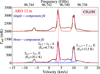 |
Fig. 2 Observed CH3OH spectrum toward IRAS 16293E shown in black, and the Gaussian fit is shown as the red curve. The vertical red line at vlsr of 3.8 km/s is centered on the strongest line with the lowest Eu. (top) A single-component fit, as reported in Table 1, and (bottom) a three-velocity fit to each transition, separated out into the green, purple, and blue curves with a total red composite curve, reproduces the full profile better, but we note that the centrally peaked profile (i.e., at the vιsr of 3.8 km/s) from our single-component fit remains the most dominant profile. |
3 Column densities
We report the first detection of the methanol isotopologues 13CH3OH, CH2DOH, and CHD2OH, and the COMs CH3CHO, HCOOCH3, and CH3OCH3 toward the emission peak of IRAS 16293E via multiple transitions from both the ARO 12 m (Figure 3) and the Yebes 40 m (Figure 4). We also report nondetections and an upper limit for CH2CHCN (Figure 3). We detail our column density calculations below.
COM lines targeted with ARO 12 m, and selection of COM lines targeted with Yebes 40 m.
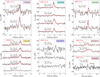 |
Fig. 3 Observed ARO 12 m spectra toward IRAS 16293E shown in black and Gaussian fits as red curves. Spectra without Gaussian fits were considered nondetections, and upper limits were derived. The vertical red lines are centered at vlsr of 3.8 km/s, and the gray horizontal lines show the 1 σ noise (RMS) level. From top left to bottom right: 13CH3OH spectra offset by 50 mK, CH2DOH spectra offset by 100 mK, CHD2OH spectra offset by 50 mK, CH3CHO spectra offset by 100 mK, CH2CHCN spectra (nondetections) offset by 50mK, HCOOCH3 spectra offset by 25mK, and a single CH3OCH3 spectrum (nondetection). |
3.1 RADEX method: CH3OH, 13CH3OH, and HCOOCH3
We began by using the non-local thermodynamic equilibrium (non-LTE) RADEX code, which assumes a uniform isothermal cloud distribution (van der Tak et al. 2007) in order to calculate column densities, N, and excitation temperatures, Tex, while minimizing over the input kinetic temperature of the gas, Tk, and the source size, θsrc, of the emitting area when possible (i.e., when more than a single transition is available). This θsrc relates to the fact that the molecular emission from our source likely does not fill the telescope beam, θbeam, uniformly. This is accounted for by dividing the observed integrated intensity by a filling factor, f, which measures the coupling between the source integrated intensity emission, I(θ, 0), and the telescope beam, Pn(θ). As described by Wilson et al. (2013), by assuming the source emission can be approximated by a Gaussian with FWHM θsrc, the filling factor is derived to be
 (1)
(1)
The number of transitions for each molecule of interest (ranged from one to three) is limited. We therefore decided to fix the input volume density within the observed beam, nbeam, in our RADEX calculations. We first calculated the median molecular hydrogen column density, NH2, directly from the Ophiuchus Herschel column density maps (André et al. 2010; Ladjelate et al. 2020) within the given telescope beam (θbeam) for each transition of interest. We found nbeam with
 (2)
(2)
where l = θbeamd is the length of the beam given a distance d to the source. For θbeam values that range from 37.4″ to 63.9″, a range of mean volume densities was calculated to be nbeam = (0.71-1.38) × 106 cm−3. These values are consistent with the volume density estimate of nH2 = 1 × 106 cm−3 reported in the literature (Stark et al. 2004). A more recent analysis from Spezzano et al. (2025) found a density nH2 ~ 5 × 105 cm−3 at −4500 au at a radius of −4500 au, which corresponds to the largest angular scale that we probe (63.9″ or ~9 000 au) and to a peak density of −3 × 106 cm−3 at the core center. We found that our RADEX column density estimates remained robust in our range of nH2 input values (see Appendix C).
The peak line temperatures (Tmb in units of K) and line widths (FWHM in units of km/s) that are additional inputs for our RADEX calculations came directly from the Gaussian fits (Table 1). As shown in Figure 2, there are multiple velocity components that we observed with the ARO 12 m for the three separate CH3OH 96.7 GHz lines that are within ~5 MHz in frequency of each other, which complicated the line fitting. We found that a single-component fit (top spectrum in Figure 2) did not fully reproduce the observed spectrum (and neither did a two-component fit). Instead, a three-component velocity fit (bottom spectrum in Figure 2) reproduced the observed spectrum best. These velocity components were comprised of a single centrally peaked component (i.e., at the vlsr of 3.8 km/s) as well as two broader components that were blue- and red-shifted from this main component. In the Yebes 40 m data, a single blueshifted emission peak is also observed at ~1.5 km/s for the 10,1 - 00,0 A transition at 48.372 GHz (see Figure 4). This blueshifted emission feature for CH3OH is seen in higher transition lines (e.g., 51,5 - 41,4 at 241.767 GHz and 50,5 - 40,4 at 241.791 GHz), as reported by Spezzano et al. (2025). We concluded, as these authors did, that the emission we probed toward the IRAS 16293E peak therefore likely also contains the line-of-sight emission from the nearby shocked-gas emission peaks E1 and HE2 (Figure 1; Kahle et al. 2023). Because we cannot disentangle this emission within our different beam sizes and are limited in the velocity resolution for our Yebes 40 m data, we assumed a single-component fit around the centrally peaked component for all observed transitions. We therefore stress that we provide here a global average for the cold COM emission toward IRAS 16293E.
Beyond the physical conditions and line parameters that need to be input in the RADEX code, collisional rates are also necessary. In the case of CH3 OH, there are separate A and E states with measured collisional rates (Rabli & Flower 2010), and they were treated as two distinct molecules, with H2 as the collisional partner. Collisional rates for the A-state transition of HCOOCH3 alone are also available, and they were scaled from He to para-H2 as the collisional partner (Faure et al. 2014; van der Tak et al. 2020). These data for CH3OH and HCOOCH3 come from the LAMDA online database3 (Schöier et al. 2005), whereas for 13CH3OH, we used the EMAA database4, which provides the collisional data needed for RADEX, where para-H2 was again the collisional partner (Dagdigian 2024).
We observed a total of three transitions for CH3OH E and two transitions for CH3OH A; therefore, using the RADEX code, for a given Tk value, we ran a grid of N values for all these transitions and then minimized over the observed and RADEX-calculated peak line temperatures to determine the best-fit N values (see also Scibelli & Shirley 2020; Scibelli et al. 2024 and Appendix B). Next, we iterated for different Tk and θsrc values to determine a consistent best-fit N for the A and E states5. We found our best-fit N and Tex values at Tk of 7.0 K and a θsrc of 115 ″ (see Table 2), which reveals that the emission area is larger than our beam, but f does not equal one. For example, for an ARO 12 m beam of 62″ f = 0.76 and for an Yebes 40 m beam of 37 ″ f = 0.90, when θsrc = 115 ″. These filling factors have non-negligible effects on the column density, and we are able to constrain θsrc in the first place because of this (see Appendix B for a more detailed discussion).
The total (A+E) column density found for CH3OH is N = (1.21 ± 0.20) × 1014 cm−2 at an average excitation temperature, Tex, of 6.6 ± 0.4 K for a θsrc of 115 ″ (Table 2). Our estimate for N is higher by roughly an order of magnitude than the LTE estimates by Kahle et al. (2023), who reported a N(CH3OH) = 8.0 ± 1.6 × 1012 cm−2 toward IRAS 16293E from higher-energy transitions (in the 277-375 GHz range with Eu ~ 17-50 K), assuming a fixed source size of 20″, an excitation temperature of Tex = 12 K, and a 20% error. We note that if Tex were lowered to ~7 K in an LTE analysis, then Kahle et al. (2023) would have obtained only a slightly higher estimate for the column density, N ~ 1 × 1013 cm−2, within the 20% error. The extended emission our observations probe is large, and at θsrc of 115 ″, this encompasses the E1 and HE2 emission peaks (see Figure 1). The discrepancy in the methanol column density might therefore either be a consequence of the contribution from E1 and HE2, or might mean that our lower Eu transitions (Eu ~ 2-20 K) that we observe at lower frequencies, which are optically thin (τ = 0.03-0.55 from RADEX), probe the cooler, less dense, and more extended methanol emission across the IRAS 16293E prestellar core and in the surrounding cloud. The APEX observations from Kahle et al. (2023) at higher frequencies selectively trace either higher-density regions and/or hot regions. It is therefore likely that our ARO 12 m and Yebes 40 m observations probe different excitation and physical conditions in the cloud. This is illustrated, for example, by the different CO maps in Kahle et al. (2023), which show the higher-energy CO J=6-5 line (Eu = 116.2 K) tracing compact emission, while the lower energy CO J=3-2 line (Eu = 33.2 K) traces more extended scales (even larger than 115 arcsec; see their Figures 2 and J.51). Future work to map CH3OH at intermediate frequencies (e.g., in the 2 mm band) would help us to disentangle this inconsistency with ARO 12 m and APEX column density estimates.
The uncertainty on our estimate of the CH3 OH column density may be exacerbated because only a single-velocity component was fit to the complex line profiles (Figure 2). We thus also calculated an N for the more optically thin transitions of 13CH3OH with less complex line profiles (Figure 3). We found a total (A+E) column density for 13CH3OH of N = (1.65 ± 0.21) × 1012 cm−2 at an excitation temperature of Tex ~ 6.6 K, and τ ~ 0.01. Because we only had a single transition for each of the 13CH3OH A and E states, we assumed the same Tk of 7.0 K and θsrc of 115″ as we found for CH3OH. We calculated a 12C/13C ratio and found a value of 73.4±9.51, which agrees within errors with the standard ISM 12C/13C ratio of 68 (Milam et al. 2005). We successfully isolated the narrow component of the methanol emission, but are still unable to measure the 12C/13C ratio for blue- and redshifted components of the CH3OH emission, which do not appear in the 13CH3OH spectra (Figures 2 and 3).
Next, for HCOOCH3 A, we minimized over the two available observed transitions to find that a Tk of 27 K is a best fit to the observations (see Appendix B). A total (A+E) N value of (4.9 ± 0.1) × 1012 cm−3 at an average Tex of 26.0±4.59 K was calculated (Table 2). The larger uncertainty in Tex (compared to the methanol species) stems from the fact that these species are in non-LTE, that is, the RADEX-derived Tex for each transition of HCOOCH3 A differs by ~5-10 K at a single given Tk. Our bestfit Tk and Tex values should be treated with caution because of the uncertainty in the 100 GHz 81,7−71,6 A line detected at the 3σ limit, which was smoothed by three channels and is significantly broader than the corresponding 36 GHz 30,3−20,2 A line (Table 1). If the 81,7−71,6 A transition is treated as a nondetection, the best-fit column density constraint remains robust, but the best-fit kinetic temperature range can now also vary by more than a factor of two, from ~14-30 K (see FigureB.1 in Appendix B). Our calculation also assumed an A:E of 1:1, which we expect to be reasonable within our errors because for CH3OH, the N values for the separate A and E states were within a factor of 1.04. As we only had two transitions for HCOOCH3 A and we already minimized over Tk, we cannot constrain θsrc and assumed f = 1.
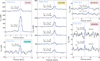 |
Fig. 4 Observed Yebes 40 m spectra toward IRAS 16293E shown in black and Gaussian fits as blue curves. The vertical blue lines are centered at vlsr of 3.8 km/s, and the gray horizontal lines show the 1σ noise (RMS) level. From top left to bottom right: CH3OH spectra offset by 1000 mK, CH2DOH spectrum, CH3CHO spectra offset by 100 mK, HCOOCH3 spectra offset by 20 mK, and CH3OCH3 spectra offset by 30 mK. |
Molecular column densities in IRAS 16293E.
3.2 LTE method: CH2DOH, CHD2OH, CH3CHO, CH3OCH3, and CH2 CHCN
For the deuterated methanol species (CH2DOH and CHD2OH) and the other targeted COMs (CH3CHO, CH3OCH3 and CH2CHCN), we used the rotation diagram (RD) method or the LTE method to calculate N because the collisional coefficients needed for the non-LTE analysis are not available. Under this approximation, the upper state column density in the optically thin limit can be calculated by
![Mathematical equation: \mathrm{N}_u = \frac{I}{h A_{ul} f} \frac{u_\nu(\mathrm{T}_\mathrm{ex})}{[J_\nu(\mathrm{T}_\mathrm{ex}) - J_\nu(\mathrm{T}_\mathrm{cmb})]},](/articles/aa/full_html/2025/10/aa53696-25/aa53696-25-eq9.png) (3)
(3)
where h is the Planck constant, f is our (frequency-dependent) filling factor, I is the integrated intensity of the line, Aul is the spontaneous emission coefficient (or Einstein A), Tcmb is the background temperature of 2.73 K, and uν (Planck energy density) and Jν (Planck function in temperature units) are defined as
 (4)
(4)
 (5)
(5)
In these equations, c is the speed of light, k is the Boltzmann constant, and ν is our line frequency. For a total column density, Ntot,
 (6)
(6)
where gu is the upper state degeneracy, Eu is the upper state energy, and Q(Tex) is the partition function dependent on the excitation temperature of the molecule. In the standard RD method, the log-normal of the left side of Equation (6), ln(Nu/gu), is plotted versus Eu so that the excitation temperature, Tex, is the inverse of the slope of the linear fit and the y-intercept is used to find Ntot (Goldsmith & Langer 1999). In our estimates, both Jν(Tex) and Jν(Tcmb) in equation 3 were considered because in the lower Tex limit, the contribution of Jν(Tcmb) is non-negligible. We then performed an iterative fitting in which all inputs were fixed, except for the input Tex, which was optimized when it equaled the inverse slope of the rotation diagram. We used this approximation to find N and Tex for CH3CHO A and CH2DOH e0 (Figure 5). We note that Q(Tex) was calculated separately for the individual torsional level substates, that is, A for CH3CHO, and EE for CH3OCH3 (see Appendix A in Scibelli 2023 for details).
We used five transitions for CH3CHO A in the calculation. While the ARO 12 m transitions show direct evidence of multiple velocity components (Figure 3), we cannot resolve this in our Yebes 40 m observations because the velocity resolution is lower (Figure 4), and we therefore only considered single-component Gaussian fits. The best-fit to the data was  cm−2 at a Tex ~ 6.8 K, which agrees with the Tex calculated for CH3OH (Table 2). For CH3CHO A, we also assumed that it is spatially extended similarly to that of CH3OH (as was done in Scibelli et al. 2021, 2024), and we thus corrected for θsrc = 115″. When we instead assumed f = 1, N is only slightly lower, by roughly 10% and within our calculated errors. The total (A+E) column density is therefore
  cm−2, and it assumes (as done above for HCOOCH3) an A:E ratio of 1:1.
For CH2DOH, we were able to observe three distinct more reliable a-type transitions (where ∆Ka = 0, ±2,...), two with the ARO 12 m, and one with the Yebes 40 m (see Table 1). We therefore constructed a rotation diagram and constrained N and Tex. As was the case for CH3CHO, we assumed θsrc = 115″ to find  cm−2 at a Tex of
  K. When f = 1 is assumed, N decreases by <10%.
For CHD2 OH, only two transitions were observed, and their Eu values only differ by ~3 K (Table 1). We therefore assumed the same Tex as found for CH2DOH of 4.55 K. This is the LTE method, which we point out is just an assumption that must be made, and likely Tk is higher than Tex here. Assuming again that θsrc = 115″, we obtained N = (2.64 ± 0.83) × 1012 cm−2 for CHD2OH. The LTE method was also used to estimate an upper limit for CH2CHCN at a fixed Tex of 10 K (see Table 2).
Figure 4 shows that the EE state of CH3OCH3 is brightest and is detected with the Yebes 40 m at 32.9 GHz (Eu = 7.0 K) and 39.0 GHz (Eu = 15.4 K). Additionally, an upper limit of 3σ is provided from the ARO 12 m at 99 GHz (Eu = 10.2 K), whose RMS level was about three times lower. This prevented a firm detection (see Table 1 and Figure 3). While these three constraints from three separate transitions can be used to create a RD (see Appendix D), several limitations in the data make this impractical. Mainly, the 39.0 GHz 51,4−50,5 transition may be untrustworthy because 1) the other AA and AE+EA states are not detected, 2) the slight 0.4 km/s offset in the vlsr and 3) the negative feature at 2.7 km/s is as deep as the detected emission line (Figure 4). Therefore, we instead assumed a standard Tex value of 10K and calculated N = 1.30 ± 0.39 × 1012 cm−2. We note that unlike for CH3CHO and the deuterated methanol species, we assumed f = 1 here (as done for HCOOCH3) because we lack an estimate of the emitting area for this molecule.
If the 39.0 GHz line of CH3OCH3 is a true detection, then this would indicate an elevated excitation temperature (~30 K; see Appendix D). It is plausible that the Tex for both HCOOCH3 and CH3OCH3 is enhanced compared to the methanol species and CH3CHO (Table 2), indicating that both species may be tracing gas that is heated by the shocks from the nearby protostars (see Section 4 for a more detailed discussion). The number of transitions is limited and the signal-to-noise ratio of the data is low, however, and therefore we are unable to confirm this temperature enhancement.
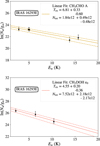 |
Fig. 5 Rotation diagrams with associated linear best fits (solid curves) and corresponding uncertainty (dashed curves) for (top) CH3CHO A, which uses five transitions, and for (bottom) CH2DOH, which uses three transitions. |
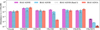 |
Fig. 6 Comparison of D-COM and COM abundances normalized to methanol for IRAS 16293E and the nearby protostars A and B from ALMA Band 7 PILS data (Jørgensen et al. 2018; Calcutt et al. 2018; Manigand et al. 2020; Drozdovskaya et al. 2022), as well as from Nazari et al. (2024), who observed IRAS 16293B in ALMA Band 3 (overlaid dotted pattern). The upper limits for CH2CHCN are bins with downward arrows that have an overlaid hatching pattern (note: not shown is the IRAS 16293B Band 3 upper limit for CH2CHCN, which is <4.9 × 10⁻⁴). The methanol column density for IRAS 16293B (Band 7) stems from the analysis of the optically thin 18O-isotopologue of methanol and subsequent assumption of the canonical 16O/18O ISM ratio (Jørgensen et al. 2018), while that for IRAS 16293A is based on the analysis of selected optically thin lines of the main isotopologue itself (Manigand et al. 2020). |
4 Discussion
The prestellar core IRAS 16293E gives us a direct view into the nascent environment where the chemically rich and well-studied protostars IRAS 16293A and B also formed. We compare our derived prestellar abundance ratios below while placing our observations into context with other star-forming regions and later-stage objects (e.g., protostars and comets).
4.1 Abundance comparisons
We first normalized our IRAS 16293E calculated COM and D-COM column densities to the CH3OH column density and compared them to the nearby protostars IRAS 16293A and B (Figure 6). The protostellar data came both from the higher-frequency (275-373GHz) ALMA Band 7 PILS data (Jørgensen et al. 2018; Calcutt et al. 2018; Manigand et al. 2020; Drozdovskaya et al. 2022) as well as from lower-frequency (84-116GHz) ALMA Band 3 data for IRAS 16293 B alone (Nazari et al. 2024). For these high-temperature and high-density protostellar regions, the optically thick methanol is a greater concern, and we therefore note that the methanol column density for IRAS 16293B in the Band 7 data (Jørgensen et al. 2018) stems from the analysis of the optically thin 18O-isotopologue of methanol and a subsequent assumption of the canonical 16O/18O ISM ratio of 560 (Wilson & Rood 1994), while that for IRAS 16293A is based on the analysis of selected optically thin lines of the main isotopologue itself (Manigand et al. 2020). In the recent Band 3 observations (Nazari et al. 2024), 13CH3OH is scaled to the main isotopologue by the 12C/13C ISM value of 68 (Milam et al. 2005).
By normalizing to CH3OH, which primarily forms on the grains (Watanabe & Kouchi 2002; Fuchs et al. 2009), we used the relative abundances of the other species to test whether the initial inventory of material survived the star formation process. As reported in other studies that compared larger heterogeneous samples (e.g., van Gelder et al. 2020; Nazari et al. 2021; Scibelli et al. 2021, 2024), we found that the protostellar COM and D-COM relative ratios with respect to CH3OH in IRAS 16293A and B are similar to those in the prestellar core IRAS 16293E. Unlike other studies, however, we uniquely compared these different stages of star formation that have evolved from the same common molecular cloud and thus directly show the inheritance of COMs from the prestellar stage.
The deuteration ratios are particularly interesting to point out in our comparison. For CHD2OH, they are statistically identical for IRAS 16293A, B, and E. We investigated this further by calculating the D/H ratios accounting for the statistical corrections that considered the number of indistinguishable combinations with i deuterium atoms at n potential sites in a specific functional group (Table 3). The D/H ratios for both CH2DOH and CHD2OH agree within the errors with a slight increase and decrease from IRAS 16293E to B to A. Correspondingly, the CHD2OH/CH2DOH ratios agree within the error, but show a downward trend as the cores evolve, that is, for IRAS 16293E, B, and A, the CHD2OH/CH2DOH ratios are 35±15%, 25±5.0%, and 20±6.8%, respectively. Another grain species, water, provides additional insight into the chemical evolution of these cores via deuteration, as Stark et al. (2004) found similar HDO abundances in IRAS 16293E and A, suggesting that the warm gas in IRAS 16293A may have undergone the same evolution and precollapse phase in which IRAS 16293E currently is. We therefore directly show from our D/H ratios that the enhanced deuterated methanol in protostars IRAS 16293A and B was set during the prestellar phase.
We also briefly mention the order-of-magnitude difference in the CH3CHO abundance from IRAS 16293A to IRAS 16293B, which has been discussed in Manigand et al. (2020) as due to differences in the spatial distributions of the molecule at different excitation conditions enhanced by the differences in geometry of the two protostellar sources. The CH3CHO abundance we measured for the prestellar source IRAS 16293E is much more consistent with IRAS 16293B, but still higher than the protostellar sources (16293B and 16293A; see Figure 6). A higher abundance toward IRAS 16293E supports the formation scenario in which CH3CHO first forms in the gas phase in the early coldcore stage (e.g., Garrod 2013; Vazart et al. 2020; Garrod et al. 2022).
Methanol deuterium ratios in IRAS 16293-2422.
4.2 Influence from nearby outflows
The outflow interaction from the IRAS 16293-2422 protostellar complex was traced, for example, by rotational transitions of molecular hydrogen detected by 4.5 μm Spitzer observations (see Figure 8 in Jørgensen et al. 2008). This emission lies spatially above IRAS 16293E and roughly matches the higher-frequency CH3OH emission as mapped by Kahle et al. (2023) and plotted as contours in Figure 1. As shown in this map, the observed beam sizes from our single-pointing observations clearly overlap with this outflow-related emission, and this results in the observed multiple velocity components for CH3OH and CH3CHO, as discussed above (Section 3), as well as in the subsequent warming of the surrounding prestellar envelope gas that could have allowed for the enhancement of observed gas-phase COM abundances toward IRAS 16293E, which we discuss here.
The abundances relative to methanol of the largest COMs we targeted in IRAS 16293E, HCOOCH3 and CH3OCH3, are comparable to the IRAS 16293A and B protostars (Figure 6). We find evidence that HCOOCH3 and CH3OCH3 might even trace warmer gas in the envelope that surrounds the central E core that has been influenced by outflow emission. In the case of HCOOCH3 A, both Tex and Tk are found to be −27 K in our RADEX calculations (assuming the secure detection of the two A state transitions listed in Table 1), although the range can expand to Tk~14 - 30 K when the 36 GHz line alone is considered trustworthy (Appendix B). As for CH3OCH3 EE, a Tex of ~30 K is found through the LTE RD method when the 39 GHz line is considered trustworthy (Figure D.2 in Appendix D), causing a three times higher abundance than the fixed Tex = 10 K estimate in Table 2. Methanol species and CH3CHO, in contrast, show Tex - 5-7 K, and for CH3OH in particular, a Tk of 7 K is found.
Scibelli et al. (2024) performed a similar analysis as we presented in Section 3 (and Appendix B) to determine the best-fit Tk for HCOOCH3 A from minimizing a RADEX grid for a sample of starless and prestellar cores in the Perseus molecular cloud. They showed that for prestellar and starless cores in regions with active protostellar outflows, Tk for HCOOCH3 is also enhanced, at −20 K. In contrast, the best-fit Tk values for CH3OH in this sample of cores is <10 K (see Scibelli et al. 2024 Appendix D). While the small number of detected transitions at low signal-to-noise ratio levels limit our confidence that Tex or Tk are truly enhanced for HCOOCH3 and/or CH3OCH3 toward prestellar sources in shocked regions, the presence or history of shocks in these regions might still have helped to facilitate the production of gas-phase COMs.
Even before COM detections in prestellar sources, the first detection of HCOOCH3 (among other species) toward the active outflow L1157-B1 revealed that shock-induced sputtering can work to help release these larger molecules from the grains (Arce et al. 2008). Later, Öberg et al. (2010) reported the detections of the COMs CH3CHO, HCOOCH3, and (tentatively) CH3OCH3, toward the B1-b system that includes a protostar, outflow and a dense core. To date, the influence of outflows and shocks and subsequent formation of complex chemistry directly in and around low-mass prestellar sources still remains a mystery.
In the high-mass case, the dark cloud G+0.693-0.027 is thought to have been shocked (e.g., Colzi et al. 2024) and provides evidence for why many highly complex species, including the recent detections of three C4H3N isomers (cyanoallene, CH2CCHCN; propargyl cyanide, HCCCH2CN; and cyanopropyne CH3CCCN; Rivilla et al. 2022) as well as the glycine isomer, glycolamide (NH2C(O)CH2OH; Rivilla et al. 2023), have all been observed in the gas phase.
The detection of large molecules in regions of active outflows and/or previously shocked quiescent gas suggests that the production of COMs can proceed efficiently in environments in which molecules are released into the gas phase from the ice mantle of the grains (see reviews Jørgensen et al. 2020; Ceccarelli et al. 2023). Slow shocks from the IRAS 16293-2422 protostellar complex (e.g., vs < 20 km/s; Garay et al. 2002) might therefore have released molecules, either from enhanced dust temperatures and/or ice sputtering, inducing more rapid COM formation. Our single-dish observations might detect enhanced HCOOCH3 and CH3OCH3 abundances and excitation temperatures in this shocked warm cloud that surrounds the core, while CH3OH and CH3CHO might more effectively trace the core itself in addition to extended lower-density and lowertemperature gas with Tk - 7 K. This derived kinetic temperature for methanol (7 K) is consistent with tracing the central prestellar core modeled to have Tk - 8 K via millimeter interferometric observations (Shah 2001; Stark et al. 2004).
As discussed in Section 3.1, it was not possible to derive an estimate on the source size for HCOOCH3 and CH3OCH3 , and we therefore assumed f = 1. We do not know the emitting area of these higher-complexity COMs, and therefore, future spatial mapping of these low-frequency transitions is needed to confirm that they trace emission in the extended cloud of IRAS 16293E. While we fit a source size for CH3OH of θsrc = 115″ and assumed the same value for its isotopologues and the chemically related CH3CHO, we caution that this might not be a true representation of the emitting region for methanol, whose kinetic temperature (−7 K) would indicate that it traces the central prestellar core. The complicated nature of the region suggests possible contamination from positions E1 or HE2 (Figure 1).
4.3 Complex chemistry in the context with other cores
The statistically corrected D/H ratios for the deuterated methanol species (CH2DOH/CH3OH and CHD2OH/CH3OH) are plotted in Figure 7 for all starless and prestellar cores for which data are available, in addition to a sample of protostars (single-dish and interferometric observations) and comet 67P/Churyumov-Gerasimenko (67P/C-G). In general, the D/H ratio increases from starless cores to prestellar cores, as expected, where lower temperatures and higher CO-depletion factors favor deuterium enrichment (e.g., Caselli 2002; Walmsley et al. 2004; Crapsi et al. 2005; Roueff et al. 2005). The enhanced ratio is then maintained into the protostellar stages; and these values match the D/H range for comet 67P/C-G well (Drozdovskaya et al. 2021). Additionally, these ratios show a higher D/H ratio of the doubly deuterated molecules than the singly deuterated ones because deuteration is more efficient when one D substitution has already taken place. This successive deuteration, that is, higher levels of fractionation in multideuterated isotopologues, has been studied previously (e.g., see Drozdovskaya et al. 2022). The similarities in D/H ratios across evolutionary stages for methanol deuteration were reported before by Lin et al. (2023), and they confirm a chemical inheritance from the prestellar stage.
In particular, we studied the placement of IRAS 16293E in relation to these literature values and found tight agreement. Both the CH2DOH/CH3OH and CHD2OH/CH3OH values in IRAS 16293E are within factors of ~ 1-3 to the prestellar sources H-MM1, which is also located in Ophiuchus, and L694-2, which is more isolated (Lin et al. 2023). Additionally, the D/H ratio for the prototypical prestellar core L1544 (Chacón-Tanarro et al. 2019) and the L18 3 prestellar core (Lattanzi et al. 2020) in the singly deuterated case also fall within a factor of 1.5 when compared to IRAS 16293E.
In our comparison to the protostellar sources, we found in general that the interferometric protostellar observations are more consistent with the single-dish prestellar constraints than with the single-dish protostellar observations (Figure 7 and Table A.1). The single-dish measurement might underestimate the D/H ratio either due to beam dilution effects, evident from the 21-30″ beam observations of L483 (Agúndez et al. 2019), or due to a real evolutionary effect as gas-phase deuterated methanol heats up and decreases in abundance during the later star formation, as is the case for the only Class I source plotted, SVS13A (beam ~10″; Bianchi et al. 2017a). In other cases, single-dish measurements might overestimate the D/H ratio due to additional uncertainties, such as unreliable line data. For example, Belloche et al. (2016) (see their footnote 7) reported that the CH2DOH column densities from Parise et al. (2002) and Parise et al. (2006) were overestimated by a factor of two because the laboratory line intensities they used were lower by a factor of two than those now reported in updated catalogs. While we corrected for this factor in our estimates for IRAS2A, IRAS4A, and IRAS4B in Figure 7, additional factors of uncertainty might stem from these early single-dish measurements, and exact comparisons should be made with caution. Future observations of deuterated methanol at higher spatial scales in both prestellar and protostellar cores should help us to resolve these discrepancies.
We also mention that while it is not a low-mass source, new observations of CH3OH and CH2DOH in the Herbig Ae disk HD 100453 reported a D/H ratio of ~1-2% (Booth et al. 2025), which is consistent with the low-mass measurements complied in Figure 7. This first (tentative) detection of deuterated methanol in a Class II disk further adds to the growing evidence that organic material from the earliest stages is inherited in the later stages of star and planet formation.
The COMs targeted in this survey (CH3OH, CH3CHO, CH2CHCN, HCOOCH3 , and CH3OCH3) are regularly searched for in other starless and prestellar cores in the literature (e.g., Bacmann et al. 2012; Vastel et al. 2014; Jiménez-Serra et al. 2016; Scibelli & Shirley 2020; Scibelli et al. 2021; Jiménez-Serra et al. 2021; Megías et al. 2023; Scibelli et al. 2024; see Table A.1). In this context, we suggest that IRAS 16293E is a typically complex prestellar core and compared its COM detections to the larger representative samples of cores in the Taurus L1495 filament (Scibelli & Shirley 2020; Scibelli 2023) and Perseus molecular cloud (Scibelli et al. 2024), with CH3CHO detection rates > 50% and CH2CHCN detection rates of < 34%. The nondetection of CH2CHCN in IRAS 16293E, despite its substantial abundance in both the evolved prestellar core L1544 (Jiménez-Serra et al. 2016) and young starless core L1521E Scibelli et al. (2021), might suggest that local environmental effects that have suppressed its gas-phase abundance. More investigation into its formation pathways in cold cores is needed, however (see discussion in Scibelli et al. 2024). It remains to be studied whether IRAS 16293E harbors any higher-complexity species, which might be released into the gas phase due to the influence from the neighboring outflows and shocks.
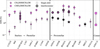 |
Fig. 7 Statistically corrected D/H ratios for all starless and prestellar sources for which data are available (Chacón-Tanarro et al. 2019; Lattanzi et al. 2020; Ambrose et al. 2021; Lin et al. 2023), including IRAS 16293E presented in this work, as well as for a mix of single-dish and interferometric (thicker outlined markers) measurements toward protostars (Parise et al. 2006; Bianchi et al. 2017a,b; Agúndez et al. 2019; Taquet et al. 2019) and comet 67P/Churyumov-Gerasimenko (67P/C-G), which is shown instead as a range of values (Table 1 in Drozdovskaya et al. 2021) because these measurements are from the ROSINA mass spectrometer, and thus, the isotopologues are not uniquely identified and more uncertain than the spectroscopic data points. Upper limits are shown with downward arrows (see also Drozdovskaya et al. 2022 and Lin et al. 2023 for similar comparison plots). |
5 Conclusions
IRAS 16293E is an intriguing prestellar core to study because it has some of the highest levels of deuteration among all starless and prestellar cores and is thought to be forming in the same natal cloud environment as its chemically rich protostellar neighbors, IRAS 16293A and B. In our joint ARO 12m and Yebes 40 m survey, we detected 13CH3OH, CH2DOH, CHD2OH, CH3CHO, HCOOCH3, and CH3OCH3 toward the emission peak of IRAS 16293E for the first time, which, when normalized to CH3 OH, show similar abundances when compared to IRAS 16293A and B. Our main findings are summarized below:
By detecting two or more transitions of each COM or DCOM, we were able to use radiative transfer techniques to place tight constraints on the abundances and excitation conditions. We found via the non-LTE RADEX method total (A+E) CH3OH and 13CH3OH column densities, N, of (1.21±0.20)×1014 cm−2 and (1.6±0.21)×1012 cm−2, respectively, and Tex values ranging from 6.54 to 6.75 K (for a Tk of 7.0 K). These results corresponds to a 12C/13C ratio of 73.4±9.51, which agrees with local ISM values. For CH3CHO (and from the independent RD method), a similar Tex of
 K was found, where the total column density was
  cm−2. While the Tex values for higher-complexity molecules HCOOCH3 and CH3OCH3 are more uncertain, the total N values are comparable to CH3CHO (within a factor of 2) at (4.9±0.10)×1012 cm−2 and (2.6±0.78)×1012 cm−2, respectively;
The influence from nearby protostellar outflows onto IRAS 16293E have warmed the outer envelope that surrounds the central prestellar core, and this emission is probed within our single-dish beams (ranging from 37″ to 73″). The single dominant emission component we analyzed for CH3OH and CH3CHO traces the colder (~10K) gas in and around the core. Still, the fact that we observe multiple velocity components for CH3 OH and CH3CHO in the higher-velocity resolution ARO 12m observations (which are also larger in beam size and therefore encompass more of the outer envelope) provides additional evidence that different emission regions are probed. HCOOCH3 and CH3OCH3 might also trace the warmer envelope, where shock-induced ice sputtering as well as the additional production and/or release of these species in the gas phase has increased the temperatures. We were unable to confirm, however, whether the calculated excitation temperatures (Tex ~ 10-30 K) are truly enhanced because our low signal-to-noise ratio lines;
The COM abundances with respect to CH3OH for IRAS 16293E, A, and B are similar within factors of <3 (with the exception of CH3 CHO for source A). Because these three sources have all formed from the same natal cloud environment, we directly showed for this system in particular that the relative abundances of COMs and D-COMs in the later protostellar stage were set during the earlier prestellar stage;
The D/H ratios (with statistical correction) for CH2DOH are similar within the errors, but increase slightly from prestellar cores to protostars, while in contrast decrease slightly for CHD2OH. More specifically, from sources IRAS 16293E, B, and A, these CHD2OH/CH2DOH ratios are 35±15%, 25±5.0% and 20±6.8%, respectively. The D/H enhancement in doubly deuterated methanol is also detected in a heterogeneous sample of starless and prestellar cores, in addition to a select number of protostars and in comet 67P/C-G. This further supports a chemical inheritance from the prestellar stage. In the context of these other sources, the abundance comparisons of the higher complexity COMs targeted in this study revealed that IRAS 16293E is a typically complex prestellar core. The effect of the nearby outflows and shocked gas might enhance the gas-phase abundances of other COMs that were not searched for thus far, however.
Future work to characterize the spatial distribution and solid phase inventory (e.g., ice compositions using JWST) of COMs and D-COMs in and around IRAS 16293E and its natal cloud will help us to shed more light on the formation pathways and on the effect of cloud environments (e.g., shocks, outflows, irradiation) on the chemistry itself.
Acknowledgements
We thank the anonymous referee for their feedback, which significantly improved the manuscript. We are thankful that we have the opportunity to conduct astronomical research on Iolkam Du’ag (Kitt Peak) in Arizona and we recognize and acknowledge the very significant cultural role and reverence that these sites have to the Tohono O’odham Nation. We sincerely thank the operators of the Arizona Radio Observatory for their assistance with the observations. The 12 m Telescope is operated by the Arizona Radio Observatory (ARO), Steward Observatory, University of Arizona, with funding from the State of Arizona, NSF MRI Grant AST-1531366 (PI Ziurys), NSF MSIP grant SV5-85009/AST- 1440254 (PI Marrone), NSF CAREER grant AST-1653228 (PI Marrone), and a PIRE grant OISE-1743747 (PI Psaltis). We also acknowledge observations carried out with the Yebes 40 m telescope (24A006). Paula Tarrío carried out the observations and the first inspection of the data quality. The 40 m radio telescope at Yebes Observatory is operated by the Spanish Geographic Institute (IGN; Ministerio de Transportes, Movilidad y Agenda Urbana). Yebes Observatory thanks the European Union’s Horizon 2020 research and innovation programme for funding support to ORP project under grant agreement No 101004719. S.S. acknowledges the National Radio Astronomy Observatory is a facility of the National Science Foundation operated under cooperative agreement by Associated Universities, Inc. M.N.D. acknowledges the Holcim Foundation Stipend. B.M.K. acknowledges the SNSF Postdoc. Mobility stipend P500PT_214459. J. Ferrer Asensio thanks RIKEN Special Postdoctoral Researcher Program (Fellowships) for financial support. Y.S. acknowledges the National Science foundation Astronomy and Astrophysics grant AST-2205474.
Appendix A Supplemental table
Abundance comparisons across cores
Appendix B RADEX minimization
Here, we show supplemental plots for the iterative non-LTE radiative transfer RADEX fitting procedure described in Section 3.1. Grids of input column density, N, at a given kinetic temperature, Tk, for each transition detected were run and then minimized by subtracting the observed peak line temperature, Tmb, from the RADEX-derived peak line temperature, Tradex, and dividing it by the observed noise, σT. When this prescription, |Tmb−Tradex|/σT, was below a value of ‘1’ it signified a ‘bestfit’. To illustrate this parameter space, in FigureB.1 we plot the grid of ‘N’ versus Tk for the case of of HCOOCH3 where the color-scale represents Tex for a specific transition. Overlaid on the grid are minimization contours which show where the best fits of both ‘A’ state transitions overlap. Subplots are also shown to illustrate what those minimization curves look like at specific Tk slices in the grid. For HCOOCH3 A, we had only these two transitions to minimize over, so we assume f = 1 (when the source size is much bigger than the beam) and fix the volume density inputs (to 7.72 × 105 cm−3 and 9.75 × 105 cm−3 for the 81,7 - 71,6 A and 30,3 - 20,2 A lines, respectively) based on beam-averaged Herschel observations (described in section 3.1). It should be noted, however, that for our molecules of interest the best-fit column density, N, was rather insensitive to the the beam-averaged volume density, nbeam across a range of Tk values (see Appendix C).
As described in section3.1, the 100 GHz HCOOCH3 81,771,6 A line should be treated with caution because it was smoothed by three channels to increase the signal-to-noise ratio and it has a linewidth significantly (~3×) broader than the corresponding 36 GHz 30,3−20,2 A line (Table 1). By treating the 3σ detected 81,7−71,6 A transition as an upper limit, our best-fit column density constraint remains robust (at ~2 × 1012 cm−2) but the best-fit kinetic temperature ranges by more than a factor of two, from Tk ~ 14-30 K (Figure B.1). It should also be noted that the excitation temperature at each point on the N and Tk grid varies by ~5–10 K depending on which transitions was plotted, i.e., the Tex for the 81,7 - 71,6 A transition is ~20K and for the 30,3 - 20,2 A transition it is ~30 K at a Tk = 27 K (compare color-scales in the two grids in Figure B.1).
The RADEX parameter space increases when more than two transitions are modeled and when the source size, θsrc, is allowed to vary, making the minimization multi-dimensional and more challenging to visualize. Therefore, in the case of CH3 OH we show representative slices of the minimization grid to illustrate how both Tk and θsrc were constrained (FigureB.2). For this molecule, we have multiple transitions observed with different telescope beam sizes, θbeam, and we use this information to solve for θsrc in equation 1 when the minimized column density of one transition from one telescope (i.e., CH3OH 20,2−10,1 A from the ARO 12 m) best matches the column density of another transition from the other telescope (i.e., CH3OH 10,1 –00,0 A from the Yebes 40 m). However, before we do that, we first constrain Tk, since this is our other free parameter in the fit aside from N. This was done with the CH3OH E transitions that both come from the ARO 12m (same θbeam) so as to better control for any source size variation.
We find that the two CH3OH E minimization curves (20,2−10,1 E and 2−1,2−1−1,1 E), plotted for a standard f = 1 (solid lines) in the top row of Figure B.2, overlap most closely at a Tk of 7 K. At a fixed Tk of 7 K, we minimized over θsrc with the CH3OH A transitions (20,2−10,1 A and 10,1−00,0 A observed with the ARO 12 m and Yebes 40 m, respectively), plotted as dashed lines at representative values of 50″, 115″, and 400″ in the bottom row of Figure B.2. The best minimization where both ‘A’ transitions overlap at a Tk of 7 K was when θsrc = 115″. In this iterative fitting, we then went back and plotted updated minimization curves for the ‘E’ transitions for θsrc = 115″ (dashed lines in top panels of Figure B.2) in order to extract the best-fit N values (see Table 2 for the exact values from the full fitting procedure). We note that this procedure assumed that Tk and θsrc for both the A and E states are the same.
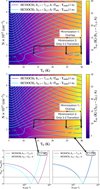 |
Fig. B.1 Grids of column density, N, versus kinetic temperature, Tk, for the case of HCOOCH3 A when excitation temperature, Tex, was calculated at each point for the 81,7 - 71,6 A transition (top) and the 30,3 - 20,2 A transition (middle). Overlaid on the grids are minimization contours for these two ‘A’ state transitions, where 81,7 - 71,6 A is in purple and 30,3 - 20,2 A is in cyan. The volume density is set to 7.72 × 105 cm−3 and 9.75 × 105 cm−3 for the 81,7 - 71,6 A and 30,3 - 20,2 A lines, respectively. In the case of ‘Minimization 1’, black arrows denote when the two modeled transitions are both best matched to the observations and overlap in N and Tk space. In the case of ‘Minimization 2’, black arrows denote where in parameter space we would expect to be if only the 30,3 - 20,2 transition was considered. Minimization curves at the bottom of the figure are also extracted at slices of the grid where Tk = 14 K, and Tk = 27 K to further illustrate how a best-fit was determined. |
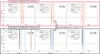 |
Fig. B.2 Representative RADEX CH3OH minimization plots for IRAS 16293E (see also Figure C1 in Scibelli et al. 2024). Plotted in each panel is the difference in the observed brightness temperature, Tmb, and the RADEX-calculated brightness temperature, Tradex, divided by the noise level, σT, versus the RADEX-calculated column density, N. When the RADEX model best fits the observations, |Tmb−Tradex|/σT was minimized and the best-fit N was found. In the top panels minimization curves are shown for the CH3OH E transitions from the ARO 12 m observations at different Tk values (in upper right corner of each plot). In the bottom panels minimization curves are shown for CH3OH A transitions, from both the ARO 12 m and Yebes 40 m observations, at a fixed Tk = 7 K and for varying θsrc values. In each plot the solid lines indicate when f – 1 was assumed and the dashed lines indicate that a specific θsrc has been used in the fit. |
Appendix C RADEX sources of uncertainty
One of the main sources of uncertainty in RADEX calculations can be the averaged volume density, nbeam, which, depending on the molecule, may affect the RADEX-calculated column density. To explore the dependence of the derived column density on the input nbeam we ran new grids. This time, we let RADEX solve for the column density, which we label here as Nbest, given our directly observed inputs (e.g., the measured Tmb) while varying nbeam from 104−107 cm−3.
For the molecules modeled with RADEX, CH3OH, 13CH3OH, and HCOOCH3, we found that Nbest was rather insensitive to the choice of nbeam at values roughly > 105 cm−3 (Figure C.1). This same dependence was also found for the case of CH3OH in Scibelli & Shirley (2020) (see their Figure 6). And, within the total range of nbeam values calculated for each transition, namely 0.71-1.38 ×106 cm−3 (described in Section 3.1), Nbest was flat with a difference of at most a factor of 1.2, which was the case only for CH3OH 20,2−10,1 E (note: dashed gray lines in Figure C.1 show this range in nbeam). Additionally, we found that changing θsrc did not alter the dependence on nbeam (left panel of Figure C.1).
For HCOOCH3, we demonstrated how the Nbest versus nbeam curves scale with the input kinetic temperature, Tk. For the two ‘A’ state transitions (81,7 - 71,6 A in black and 30,3 - 20,2 A in red) representative curves for Tk = 7 K (solid line), Tk = 15 K (dashed line), and Tk = 27 K (dotted line) are plotted in the right panel of Figure C.1. We found changing Tk does not alter the dependence on nbeam. As also seen in our minimization grid (Figure B.1), and again assuming here that θsrc ≫ θbeam or f – 1, the Nbest for both transitions converged at a Tk of 27 K, i.e., where the dotted red curve meets the dotted black curve (right panel of Figure C.1).
Appendix D Supplemental LTE fitting
We explore different LTE methods as supplemental analysis for the COMs HCOOCH3 and CH3OCH3. In Figure D.1, we plot a rotation diagram (method described in Section 3.2) for HCOOCH3 A and find  K and
K and  . The fitted column density was consistent with the RADEX minimization method, but Tex was a factor of two lower (see Table 2). We know from Figure B.1 in Appendix B that this value was still within RADEX’s ‘best-fit’ parameter space and indicates Tex derived from the LTE approach was at the lower end of the range. We therefore stress that due to our limited number of transitions at low signal-to-noise ratios and possible non-LTE effects (i.e., in the RADEX calculations Tex for the two separate transitions can vary by ~5-10 K for the same Tk; see Figure B.1), the exact Tex for HCOOCH3 in IRAS 16293E remains uncertain.
In the case of CH3OCH3 we plot two separate rotation diagrams for the ‘EE’ states, one if the 51,4 - 50,5 EE transition (Eu=15.4 K) was considered a detection (Tmb = 10.6 mK; Table 1) and one of it was considered an upper limit (Tmb = 3σ = 5.7 mK; Figure D.2). Similarly, in Figure D.3, we attempted fits to the data with synthetic spectra of the CH3OCH3 EE lines for different Tex values. We varied the column density so as to bestmatch the observed intensity for the 31,2 - 30,3 EE transition. For these synthetic spectra fits we assumed a fixed line width (0.7 km/s) and f = 1. And, while the 41,4 - 30,3 transition was not detected, we use this as an upper limit anchor. In either method, if one assumes the 51,4 - 50,5 EE transition was a detection, then a Tex of ~30K best matches the observations. However, if it was just an upper limit, then the Tex would be lowered (~10K).
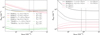 |
Fig. C.1 RADEX-calculated column density, Nbest, variation for different inputs of the beam-average volume density, nbeam. (left) Methanol (CH3OH and 13CH3OH) transitions are plotted in the case assuming a filling fraction of 1 (f = 1) or θsrc = 115″. (right) Methyl formate (HCOOCH3 A) transitions are plotted for different kinetic temperature, Tk, values. The vertical gray dashed lines show the range in beam-averaged volume densities used in our analysis. |
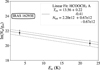 |
Fig. D.1 Rotation diagram with associated linear best-fits (solid curves) and corresponding uncertainty (dashed curves) for HCOOCH3, using the two A state transitions detected towards IRAS 16293E. |
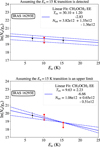 |
Fig. D.2 Rotation diagram with associated linear best-fits (solid curves) and corresponding uncertainty (dashed curves) for CH3OCH3 using the EE state transitions observed toward IRAS 16293E assuming either the 51,4 - 50,5 EE transition (Eu=15.4K) was a detection (top) or upper limit (bottom). |
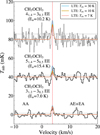 |
Fig. D.3 Synthetic spectra fits to the CH3OCH3 EE lines from the ARO 12 m (top) and Yebes 40 m (middle and bottom). Note that the ARO 12 m transition (the 41,4−30,3 EE line) was not detected above 3σ and therefore only provides an upper limit. Spectra are offset by 40 mK for easier viewing. The vertical red line is centered at a vlsr of 3.8 km/s and the gray horizontal lines show the 1σ noise (RMS) level. Only for the 31,2 - 30,3 transition are the AA and AE+EA torsional states detected above the noise. |
References
- Agúndez, M., Marcelino, N., Cernicharo, J., Roueff, E., & Tafalla, M. 2019, A&A, 625, A147 [Google Scholar]
- Agúndez, M., Marcelino, N., Tercero, B., et al. 2021, A&A, 649, L4 [NASA ADS] [CrossRef] [EDP Sciences] [Google Scholar]
- Ambrose, H. E., Shirley, Y. L., & Scibelli, S. 2021, MNRAS, 501, 347 [Google Scholar]
- Andre, P., Ward-Thompson, D., & Barsony, M. 2000, in Protostars and Planets IV, eds. V. Mannings, A. P. Boss, & S. S. Russell, 59 [Google Scholar]
- André, P., Men’shchikov, A., Bontemps, S., et al. 2010, A&A, 518, L102 [NASA ADS] [CrossRef] [EDP Sciences] [Google Scholar]
- Arce, H. G., Santiago-García, J., Jørgensen, J. K., Tafalla, M., & Bachiller, R. 2008, ApJ, 681, L21 [NASA ADS] [CrossRef] [Google Scholar]
- Bacmann, A., Lefloch, B., Ceccarelli, C., et al. 2003, ApJ, 585, L55 [NASA ADS] [CrossRef] [Google Scholar]
- Bacmann, A., Taquet, V., Faure, A., Kahane, C., & Ceccarelli, C. 2012, A&A, 541, L12 [NASA ADS] [CrossRef] [EDP Sciences] [Google Scholar]
- Bauder, A. 1979, J. Phys. Chem. Ref. Data, 8, 583 [Google Scholar]
- Belloche, A., Müller, H. S. P., Garrod, R. T., & Menten, K. M. 2016, A&A, 587, A91 [NASA ADS] [CrossRef] [EDP Sciences] [Google Scholar]
- Bianchi, E., Codella, C., Ceccarelli, C., et al. 2017a, MNRAS, 467, 3011 [NASA ADS] [CrossRef] [Google Scholar]
- Bianchi, E., Codella, C., Ceccarelli, C., et al. 2017b, A&A, 606, L7 [NASA ADS] [CrossRef] [EDP Sciences] [Google Scholar]
- Bianchi, E., Codella, C., Ceccarelli, C., et al. 2019, MNRAS, 483, 1850 [Google Scholar]
- Booth, A. S., Walsh, C., Terwisscha van Scheltinga, J., et al. 2021, Nat. Astron., 5, 684 [NASA ADS] [CrossRef] [Google Scholar]
- Booth, A. S., Wölfer, L., Temmink, M., et al. 2025, ApJ, 986, L9 [Google Scholar]
- Bottinelli, S., Ceccarelli, C., Lefloch, B., et al. 2004, ApJ, 615, 354 [Google Scholar]
- Bottinelli, S., Ceccarelli, C., Williams, J. P., & Lefloch, B. 2007, A&A, 463, 601 [NASA ADS] [CrossRef] [EDP Sciences] [Google Scholar]
- Brown, P. D., & Millar, T. J. 1989, MNRAS, 237, 661 [NASA ADS] [Google Scholar]
- Brünken, S., Sipilä, O., Chambers, E. T., et al. 2014, Nature, 516, 219 [Google Scholar]
- Calcutt, H., Jørgensen, J. K., Müller, H. S. P., et al. 2018, A&A, 616, A90 [NASA ADS] [CrossRef] [EDP Sciences] [Google Scholar]
- Caselli, P. 2002, Planet. Space Sci., 50, 1133 [NASA ADS] [CrossRef] [Google Scholar]
- Caselli, P., Stantcheva, T., Shalabiea, O., Shematovich, V. I., & Herbst, E. 2002, Planet. Space Sci., 50, 1257 [Google Scholar]
- Caselli, P., van der Tak, F. F. S., Ceccarelli, C., & Bacmann, A. 2003, A&A, 403, L37 [CrossRef] [EDP Sciences] [Google Scholar]
- Caselli, P., Vastel, C., Ceccarelli, C., et al. 2008, A&A, 492, 703 [NASA ADS] [CrossRef] [EDP Sciences] [Google Scholar]
- Castets, A., Ceccarelli, C., Loinard, L., Caux, E., & Lefloch, B. 2001, A&A, 375, 40 [NASA ADS] [CrossRef] [EDP Sciences] [Google Scholar]
- Cazaux, S., Tielens, A. G. G. M., Ceccarelli, C., et al. 2003, ApJ, 593, L51 [CrossRef] [Google Scholar]
- Cazzoli, G., & Kisiel, Z. 1988, J. Mol. Spectrosc., 130, 303 [NASA ADS] [CrossRef] [Google Scholar]
- Ceccarelli, C., Vastel, C., Tielens, A. G. G. M., et al. 2002, A&A, 381, L17 [NASA ADS] [CrossRef] [EDP Sciences] [Google Scholar]
- Ceccarelli, C., Codella, C., Balucani, N., et al. 2023, in Astronomical Society of the Pacific Conference Series, 534, Protostars and Planets VII, eds. S. Inutsuka, Y. Aikawa, T. Muto, K. Tomida, & M. Tamura, 379 [Google Scholar]
- Chacón-Tanarro, A., Caselli, P., Bizzocchi, L., et al. 2019, A&A, 622, A141 [Google Scholar]
- Chimiak, L. M. E. 2021, PhD thesis, California Institute of Technology, USA [Google Scholar]
- Colzi, L., Martín-Pintado, J., Zeng, S., et al. 2024, A&A, 690, A121 [NASA ADS] [CrossRef] [EDP Sciences] [Google Scholar]
- Coudert, L. H., Zemouli, M., Motiyenko, R. A., Margulès, L., & Klee, S. 2014, J. Chem. Phys., 140, 064307 [NASA ADS] [CrossRef] [Google Scholar]
- Crapsi, A., Caselli, P., Walmsley, C. M., et al. 2005, ApJ, 619, 379 [Google Scholar]
- Crapsi, A., Caselli, P., Walmsley, M. C., & Tafalla, M. 2007, A&A, 470, 221 [NASA ADS] [CrossRef] [EDP Sciences] [Google Scholar]
- Dagdigian, P. J. 2024, MNRAS, 527, 2209 [Google Scholar]
- Drozdovskaya, M. N., van Dishoeck, E. F., Rubin, M., Jørgensen, J. K., & Altwegg, K. 2019, MNRAS, 490, 50 [Google Scholar]
- Drozdovskaya, M. N., Schroeder I, I. R. H. G., Rubin, M., et al. 2021, MNRAS, 500, 4901 [Google Scholar]
- Drozdovskaya, M. N., Coudert, L. H., Margulès, L., et al. 2022, A&A, 659, A69 [NASA ADS] [CrossRef] [EDP Sciences] [Google Scholar]
- Durig, J. R., Li, Y. S., & Groner, P. 1976, J. Mol. Spectrosc., 62, 159 [Google Scholar]
- Dzib, S. A., Ortiz-León, G. N., Hernández-Gómez, A., et al. 2018, A&A, 614, A20 [NASA ADS] [CrossRef] [EDP Sciences] [Google Scholar]
- Endres, C. P., Drouin, B. J., Pearson, J. C., et al. 2009, A&A, 504, 635 [NASA ADS] [CrossRef] [EDP Sciences] [Google Scholar]
- Endres, C. P., Schlemmer, S., Schilke, P., Stutzki, J., & Müller, H. S. P. 2016, J. Mol. Spectrosc., 327, 95 [NASA ADS] [CrossRef] [Google Scholar]
- Evans, L., Booth, A. S., Walsh, C., et al. 2025, ApJ, 982, 62 [Google Scholar]
- Faure, A., Remijan, A. J., Szalewicz, K., & Wiesenfeld, L. 2014, ApJ, 783, 72 [CrossRef] [Google Scholar]
- Fuchs, G. W., Cuppen, H. M., Ioppolo, S., et al. 2009, A&A, 505, 629 [NASA ADS] [CrossRef] [EDP Sciences] [Google Scholar]
- Garay, G., Mardones, D., Rodríguez, L. F., Caselli, P., & Bourke, T. L. 2002, ApJ, 567, 980 [Google Scholar]
- Garrod, R. T. 2013, ApJ, 765, 60 [Google Scholar]
- Garrod, R. T., Jin, M., Matis, K. A., et al. 2022, ApJS, 259, 1 [NASA ADS] [CrossRef] [Google Scholar]
- Gerin, M., Lis, D. C., Philipp, S., et al. 2006, A&A, 454, L63 [NASA ADS] [CrossRef] [EDP Sciences] [Google Scholar]
- Gildas Team 2013, GILDAS: Grenoble Image and Line Data Analysis Software [Google Scholar]
- Ginsburg, A., & Mirocha, J. 2011, PySpecKit: Python Spectroscopic Toolkit, Astrophysics Source Code Library [record ascl:1109.001] [Google Scholar]
- Ginsburg, A., Sokolov, V., de Val-Borro, M., et al. 2022, AJ, 163, 291 [NASA ADS] [CrossRef] [Google Scholar]
- Goldsmith, P. F., & Langer, W. D. 1999, ApJ, 517, 209 [Google Scholar]
- Gratier, P., Majumdar, L., Ohishi, M., et al. 2016, ApJS, 225, 25 [Google Scholar]
- Hänni, N., Altwegg, K., Baklouti, D., et al. 2023, A&A, 678, A22 [NASA ADS] [CrossRef] [EDP Sciences] [Google Scholar]
- Herbst, E., & van Dishoeck, E. F. 2009, ARA&A, 47, 427 [NASA ADS] [CrossRef] [Google Scholar]
- Ilyushin, V., Kryvda, A., & Alekseev, E. 2009, J. Mol. Spectrosc., 255, 32 [NASA ADS] [CrossRef] [Google Scholar]
- Jiménez-Serra, I., Vasyunin, A. I., Caselli, P., et al. 2016, ApJ, 830, L6 [Google Scholar]
- Jiménez-Serra, I., Vasyunin, A. I., Spezzano, S., et al. 2021, ApJ, 917, 44 [CrossRef] [Google Scholar]
- Jørgensen, J. K., Johnstone, D., Kirk, H., et al. 2008, ApJ, 683, 822 [CrossRef] [Google Scholar]
- Jørgensen, J. K., Favre, C., Bisschop, S. E., et al. 2012, ApJ, 757, L4 [Google Scholar]
- Jørgensen, J. K., van der Wiel, M. H. D., Coutens, A., et al. 2016, A&A, 595, A117 [Google Scholar]
- Jørgensen, J. K., Müller, H. S. P., Calcutt, H., et al. 2018, A&A, 620, A170 [Google Scholar]
- Jørgensen, J. K., Belloche, A., & Garrod, R. T. 2020, ARA&A, 58, 727 [Google Scholar]
- Kahle, K. A., Hernández-Gómez, A., Wyrowski, F., & Menten, K. M. 2023, A&A, 673, A143 [NASA ADS] [CrossRef] [EDP Sciences] [Google Scholar]
- Karakawa, Y., Oka, K., Odashima, H., Takagi, K., & Tsunekawa, S. 2001, J. Mol. Spectrosc., 210, 196 [Google Scholar]
- Keto, E. & Caselli, P. 2008, ApJ, 683, 238 [Google Scholar]
- Kleiner, I., Lovas, F. J., & Godefroid, M. 1996, J. Phys. Chem. Ref. Data, 25, 1113 [CrossRef] [Google Scholar]
- Ladjelate, B., André, P., Könyves, V., et al. 2020, A&A, 638, A74 [NASA ADS] [CrossRef] [EDP Sciences] [Google Scholar]
- Lattanzi, V., Bizzocchi, L., Vasyunin, A. I., et al. 2020, A&A, 633, A118 [NASA ADS] [CrossRef] [EDP Sciences] [Google Scholar]
- Lee, C.-F., Codella, C., Li, Z.-Y., & Liu, S.-Y. 2019, ApJ, 876, 63 [Google Scholar]
- Lefloch, B., Ceccarelli, C., Codella, C., et al. 2017, MNRAS, 469, L73 [Google Scholar]
- Lin, Y., Spezzano, S., & Caselli, P. 2023, A&A, 669, L6 [NASA ADS] [CrossRef] [EDP Sciences] [Google Scholar]
- Linsky, J. L., Draine, B. T., Moos, H. W., et al. 2006, ApJ, 647, 1106 [Google Scholar]
- Lis, D. C., Gerin, M., Roueff, E., Vastel, C., & Phillips, T. G. 2006, ApJ, 636, 916 [NASA ADS] [CrossRef] [Google Scholar]
- Lis, D. C., Wootten, H. A., Gerin, M., et al. 2016, ApJ, 827, 133 [NASA ADS] [CrossRef] [Google Scholar]
- Loinard, L., Castets, A., Ceccarelli, C., Caux, E., & Tielens, A. G. G. M. 2001, ApJ, 552, L163 [NASA ADS] [CrossRef] [Google Scholar]
- Lovas, F. J., Lutz, H., & Dreizler, H. 1979, J. Phys. Chem. Ref. Data, 8, 1051 [NASA ADS] [CrossRef] [Google Scholar]
- Mangum, J. G. 1993, PASP, 105, 117 [Google Scholar]
- Manigand, S., Calcutt, H., Jørgensen, J. K., et al. 2019, A&A, 623, A69 [NASA ADS] [CrossRef] [EDP Sciences] [Google Scholar]
- Manigand, S., Jørgensen, J. K., Calcutt, H., et al. 2020, A&A, 635, A48 [NASA ADS] [CrossRef] [EDP Sciences] [Google Scholar]
- Maret, S., Ceccarelli, C., Tielens, A. G. G. M., et al. 2005, A&A, 442, 527 [NASA ADS] [CrossRef] [EDP Sciences] [Google Scholar]
- Megías, A., Jiménez-Serra, I., Martín-Pintado, J., et al. 2023, MNRAS, 519, 1601 [Google Scholar]
- Milam, S. N., Savage, C., Brewster, M. A., Ziurys, L. M., & Wyckoff, S. 2005, ApJ, 634, 1126 [Google Scholar]
- Müller, H. S. P., Thorwirth, S., Roth, D. A., & Winnewisser, G. 2001, A&A, 370, L49 [Google Scholar]
- Müller, H. S. P., Schlöder, F., Stutzki, J., & Winnewisser, G. 2005, J. Mol. Struct., 742, 215 [Google Scholar]
- Nagy, Z., Spezzano, S., Caselli, P., et al. 2019, A&A, 630, A136 [NASA ADS] [CrossRef] [EDP Sciences] [Google Scholar]
- Nazari, P., van Gelder, M. L., van Dishoeck, E. F., et al. 2021, A&A, 650, A150 [EDP Sciences] [Google Scholar]
- Nazari, P., Cheung, J. S. Y., Asensio, J. F., et al. 2024, A&A, 686, A59 [NASA ADS] [CrossRef] [EDP Sciences] [Google Scholar]
- Öberg, K. I., & Bergin, E. A. 2021, Phys. Rep., 893, 1 [Google Scholar]
- Öberg, K. I., Bottinelli, S., Jørgensen, J. K., & van Dishoeck, E. F. 2010, ApJ, 716, 825 [Google Scholar]
- Ogata, K., Odashima, H., Takagi, K., & Tsunekawa, S. 2004, J. Mol. Spectrosc., 225, 14 [Google Scholar]
- Pagani, L., Belloche, A., & Parise, B. 2024, A&A, 691, A88 [NASA ADS] [CrossRef] [EDP Sciences] [Google Scholar]
- Parise, B., Ceccarelli, C., Tielens, A. G. G. M., et al. 2002, A&A, 393, L49 [NASA ADS] [CrossRef] [EDP Sciences] [Google Scholar]
- Parise, B., Castets, A., Herbst, E., et al. 2004, A&A, 416, 159 [NASA ADS] [CrossRef] [EDP Sciences] [Google Scholar]
- Parise, B., Ceccarelli, C., Tielens, A. G. G. M., et al. 2006, A&A, 453, 949 [NASA ADS] [CrossRef] [EDP Sciences] [Google Scholar]
- Pearson, J. C., Yu, S., & Drouin, B. J. 2012, J. Mol. Spectrosc., 280, 119 [NASA ADS] [CrossRef] [Google Scholar]
- Pety, J. 2005, in SF2A-2005: Semaine de l’Astrophysique Francaise, eds. F. Casoli, T. Contini, J. M. Hameury, & L. Pagani, 721 [Google Scholar]
- Pickett, H. M., Poynter, R. L., Cohen, E. A., et al. 1998, J. Quant. Spec. Radiat. Transf., 60, 883 [Google Scholar]
- Rabli, D., & Flower, D. R. 2010, MNRAS, 406, 95 [Google Scholar]
- Rivilla, V. M., Jiménez-Serra, I., Martín-Pintado, J., et al. 2022, Front. Astron. Space Sci., 9, 876870 [NASA ADS] [CrossRef] [Google Scholar]
- Rivilla, V. M., Sanz-Novo, M., Jiménez-Serra, I., et al. 2023, ApJ, 953, L20 [NASA ADS] [CrossRef] [Google Scholar]
- Roberts, H., Herbst, E., & Millar, T. J. 2003, ApJ, 591, L41 [CrossRef] [Google Scholar]
- Roueff, E., Lis, D. C., van der Tak, F. F. S., Gerin, M., & Goldsmith, P. F. 2005, A&A, 438, 585 [NASA ADS] [CrossRef] [EDP Sciences] [Google Scholar]
- Schöier, F. L., van der Tak, F. F. S., van Dishoeck, E. F., & Black, J. H. 2005, A&A, 432, 369 [Google Scholar]
- Scibelli, S. 2023, PhD thesis, University of Arizona, USA [Google Scholar]
- Scibelli, S., & Shirley, Y. 2020, ApJ, 891, 73 [NASA ADS] [CrossRef] [Google Scholar]
- Scibelli, S., Shirley, Y., Vasyunin, A., & Launhardt, R. 2021, MNRAS, 504, 5754 [NASA ADS] [CrossRef] [Google Scholar]
- Scibelli, S., Shirley, Y., Megías, A., & Jiménez-Serra, I. 2024, MNRAS, 533, 4104 [Google Scholar]
- Shah, R. Y. 2001, in American Astronomical Society Meeting Abstracts, 199, 60.01 [Google Scholar]
- Shah, R. Y., & Wootten, A. 2001, ApJ, 554, 933 [NASA ADS] [CrossRef] [Google Scholar]
- Soma, T., Sakai, N., Watanabe, Y., & Yamamoto, S. 2015, ApJ, 802, 74 [NASA ADS] [CrossRef] [Google Scholar]
- Soma, T., Sakai, N., Watanabe, Y., & Yamamoto, S. 2018, ApJ, 854, 116 [Google Scholar]
- Spezzano, S., Redaelli, E., Caselli, P., et al. 2025, A&A, 694, A27 [NASA ADS] [CrossRef] [EDP Sciences] [Google Scholar]
- Stark, R., Sandell, G., Beck, S. C., et al. 2004, ApJ, 608, 341 [NASA ADS] [CrossRef] [Google Scholar]
- Stolze, M., & Sutter, D. H. 1985, Zeitsch. Naturfor. A, 40, 998 [Google Scholar]
- Taquet, V., López-Sepulcre, A., Ceccarelli, C., et al. 2015, ApJ, 804, 81 [Google Scholar]
- Taquet, V., Bianchi, E., Codella, C., et al. 2019, A&A, 632, A19 [NASA ADS] [CrossRef] [EDP Sciences] [Google Scholar]
- Tercero, F., López-Pérez, J. A., Gallego, J. D., et al. 2021, A&A, 645, A37 [EDP Sciences] [Google Scholar]
- van der Tak, F. F. S., Black, J. H., Schöier, F. L., Jansen, D. J., & van Dishoeck, E. F. 2007, A&A, 468, 627 [NASA ADS] [CrossRef] [EDP Sciences] [Google Scholar]
- van der Tak, F. F. S., Lique, F., Faure, A., Black, J. H., & van Dishoeck, E. F. 2020, Atoms, 8, 15 [Google Scholar]
- van Gelder, M. L., Tabone, B., Tychoniec, U., et al. 2020, A&A, 639, A87 [NASA ADS] [CrossRef] [EDP Sciences] [Google Scholar]
- Vastel, C., Phillips, T. G., & Yoshida, H. 2004, ApJ, 606, L127 [Google Scholar]
- Vastel, C., Ceccarelli, C., Lefloch, B., & Bachiller, R. 2014, ApJ, 795, L2 [NASA ADS] [CrossRef] [Google Scholar]
- Vazart, F., Ceccarelli, C., Balucani, N., Bianchi, E., & Skouteris, D. 2020, MNRAS, 499, 5547 [Google Scholar]
- Walmsley, C. M., Flower, D. R., & Pineau des Forêts, G. 2004, A&A, 418, 1035 [NASA ADS] [CrossRef] [EDP Sciences] [Google Scholar]
- Walsh, C., Loomis, R. A., Öberg, K. I., et al. 2016, ApJ, 823, L10 [NASA ADS] [CrossRef] [Google Scholar]
- Watanabe, N., & Kouchi, A. 2002, ApJ, 571, L173 [Google Scholar]
- Wilson, T. L., & Rood, R. 1994, ARA&A, 32, 191 [Google Scholar]
- Wilson, T. L., Rohlfs, K., & Hüttemeister, S. 2013, Tools of Radio Astronomy (Berlin, Heidelberg: Springer) [Google Scholar]
- Wootten, A., & Loren, R. B. 1987, ApJ, 317, 220 [NASA ADS] [CrossRef] [Google Scholar]
- Xu, L.-H., & Lovas, F. J. 1997, J. Phys. Chem. Ref. Data, 26, 17 [Google Scholar]
- Xu, L.-H., Fisher, J., Lees, R. M., et al. 2008, J. Mol. Spectrosc., 251, 305 [NASA ADS] [CrossRef] [Google Scholar]
All Tables
COM lines targeted with ARO 12 m, and selection of COM lines targeted with Yebes 40 m.
All Figures
|
Fig. 1 Map of the IRAS 16293-2422 region from publicly available APEX data presented by Kahle et al. 2023, where the color map is N2H+ (3-2) at 279.511 GHz, and the cyan contours show the CH3OH-A+ 11−00 b-type transition at 350.905 GHz (beam size for N2H+ is 23.7″ and shown in the bottom left corner). Crosses designate the locations of the IRAS 16293E prestellar core, labeled E, and the IRAS 16293A and B protostars labeled A/B. Other emission regions studied by Kahle et al. 2023 are labeled by white squares. For the single-pointing observations presented here, we also show the largest (ARO 12 m beam at 73″) and smallest beam size (Yebes 40 m beam at 37″). |
| In the text | |
|
Fig. 2 Observed CH3OH spectrum toward IRAS 16293E shown in black, and the Gaussian fit is shown as the red curve. The vertical red line at vlsr of 3.8 km/s is centered on the strongest line with the lowest Eu. (top) A single-component fit, as reported in Table 1, and (bottom) a three-velocity fit to each transition, separated out into the green, purple, and blue curves with a total red composite curve, reproduces the full profile better, but we note that the centrally peaked profile (i.e., at the vιsr of 3.8 km/s) from our single-component fit remains the most dominant profile. |
| In the text | |
|
Fig. 3 Observed ARO 12 m spectra toward IRAS 16293E shown in black and Gaussian fits as red curves. Spectra without Gaussian fits were considered nondetections, and upper limits were derived. The vertical red lines are centered at vlsr of 3.8 km/s, and the gray horizontal lines show the 1 σ noise (RMS) level. From top left to bottom right: 13CH3OH spectra offset by 50 mK, CH2DOH spectra offset by 100 mK, CHD2OH spectra offset by 50 mK, CH3CHO spectra offset by 100 mK, CH2CHCN spectra (nondetections) offset by 50mK, HCOOCH3 spectra offset by 25mK, and a single CH3OCH3 spectrum (nondetection). |
| In the text | |
|
Fig. 4 Observed Yebes 40 m spectra toward IRAS 16293E shown in black and Gaussian fits as blue curves. The vertical blue lines are centered at vlsr of 3.8 km/s, and the gray horizontal lines show the 1σ noise (RMS) level. From top left to bottom right: CH3OH spectra offset by 1000 mK, CH2DOH spectrum, CH3CHO spectra offset by 100 mK, HCOOCH3 spectra offset by 20 mK, and CH3OCH3 spectra offset by 30 mK. |
| In the text | |
|
Fig. 5 Rotation diagrams with associated linear best fits (solid curves) and corresponding uncertainty (dashed curves) for (top) CH3CHO A, which uses five transitions, and for (bottom) CH2DOH, which uses three transitions. |
| In the text | |
|
Fig. 6 Comparison of D-COM and COM abundances normalized to methanol for IRAS 16293E and the nearby protostars A and B from ALMA Band 7 PILS data (Jørgensen et al. 2018; Calcutt et al. 2018; Manigand et al. 2020; Drozdovskaya et al. 2022), as well as from Nazari et al. (2024), who observed IRAS 16293B in ALMA Band 3 (overlaid dotted pattern). The upper limits for CH2CHCN are bins with downward arrows that have an overlaid hatching pattern (note: not shown is the IRAS 16293B Band 3 upper limit for CH2CHCN, which is <4.9 × 10⁻⁴). The methanol column density for IRAS 16293B (Band 7) stems from the analysis of the optically thin 18O-isotopologue of methanol and subsequent assumption of the canonical 16O/18O ISM ratio (Jørgensen et al. 2018), while that for IRAS 16293A is based on the analysis of selected optically thin lines of the main isotopologue itself (Manigand et al. 2020). |
| In the text | |
|
Fig. 7 Statistically corrected D/H ratios for all starless and prestellar sources for which data are available (Chacón-Tanarro et al. 2019; Lattanzi et al. 2020; Ambrose et al. 2021; Lin et al. 2023), including IRAS 16293E presented in this work, as well as for a mix of single-dish and interferometric (thicker outlined markers) measurements toward protostars (Parise et al. 2006; Bianchi et al. 2017a,b; Agúndez et al. 2019; Taquet et al. 2019) and comet 67P/Churyumov-Gerasimenko (67P/C-G), which is shown instead as a range of values (Table 1 in Drozdovskaya et al. 2021) because these measurements are from the ROSINA mass spectrometer, and thus, the isotopologues are not uniquely identified and more uncertain than the spectroscopic data points. Upper limits are shown with downward arrows (see also Drozdovskaya et al. 2022 and Lin et al. 2023 for similar comparison plots). |
| In the text | |
|
Fig. B.1 Grids of column density, N, versus kinetic temperature, Tk, for the case of HCOOCH3 A when excitation temperature, Tex, was calculated at each point for the 81,7 - 71,6 A transition (top) and the 30,3 - 20,2 A transition (middle). Overlaid on the grids are minimization contours for these two ‘A’ state transitions, where 81,7 - 71,6 A is in purple and 30,3 - 20,2 A is in cyan. The volume density is set to 7.72 × 105 cm−3 and 9.75 × 105 cm−3 for the 81,7 - 71,6 A and 30,3 - 20,2 A lines, respectively. In the case of ‘Minimization 1’, black arrows denote when the two modeled transitions are both best matched to the observations and overlap in N and Tk space. In the case of ‘Minimization 2’, black arrows denote where in parameter space we would expect to be if only the 30,3 - 20,2 transition was considered. Minimization curves at the bottom of the figure are also extracted at slices of the grid where Tk = 14 K, and Tk = 27 K to further illustrate how a best-fit was determined. |
| In the text | |
|
Fig. B.2 Representative RADEX CH3OH minimization plots for IRAS 16293E (see also Figure C1 in Scibelli et al. 2024). Plotted in each panel is the difference in the observed brightness temperature, Tmb, and the RADEX-calculated brightness temperature, Tradex, divided by the noise level, σT, versus the RADEX-calculated column density, N. When the RADEX model best fits the observations, |Tmb−Tradex|/σT was minimized and the best-fit N was found. In the top panels minimization curves are shown for the CH3OH E transitions from the ARO 12 m observations at different Tk values (in upper right corner of each plot). In the bottom panels minimization curves are shown for CH3OH A transitions, from both the ARO 12 m and Yebes 40 m observations, at a fixed Tk = 7 K and for varying θsrc values. In each plot the solid lines indicate when f – 1 was assumed and the dashed lines indicate that a specific θsrc has been used in the fit. |
| In the text | |
|
Fig. C.1 RADEX-calculated column density, Nbest, variation for different inputs of the beam-average volume density, nbeam. (left) Methanol (CH3OH and 13CH3OH) transitions are plotted in the case assuming a filling fraction of 1 (f = 1) or θsrc = 115″. (right) Methyl formate (HCOOCH3 A) transitions are plotted for different kinetic temperature, Tk, values. The vertical gray dashed lines show the range in beam-averaged volume densities used in our analysis. |
| In the text | |
|
Fig. D.1 Rotation diagram with associated linear best-fits (solid curves) and corresponding uncertainty (dashed curves) for HCOOCH3, using the two A state transitions detected towards IRAS 16293E. |
| In the text | |
|
Fig. D.2 Rotation diagram with associated linear best-fits (solid curves) and corresponding uncertainty (dashed curves) for CH3OCH3 using the EE state transitions observed toward IRAS 16293E assuming either the 51,4 - 50,5 EE transition (Eu=15.4K) was a detection (top) or upper limit (bottom). |
| In the text | |
|
Fig. D.3 Synthetic spectra fits to the CH3OCH3 EE lines from the ARO 12 m (top) and Yebes 40 m (middle and bottom). Note that the ARO 12 m transition (the 41,4−30,3 EE line) was not detected above 3σ and therefore only provides an upper limit. Spectra are offset by 40 mK for easier viewing. The vertical red line is centered at a vlsr of 3.8 km/s and the gray horizontal lines show the 1σ noise (RMS) level. Only for the 31,2 - 30,3 transition are the AA and AE+EA torsional states detected above the noise. |
| In the text | |
Current usage metrics show cumulative count of Article Views (full-text article views including HTML views, PDF and ePub downloads, according to the available data) and Abstracts Views on Vision4Press platform.
Data correspond to usage on the plateform after 2015. The current usage metrics is available 48-96 hours after online publication and is updated daily on week days.
Initial download of the metrics may take a while.