Fig. C.1
Download original image
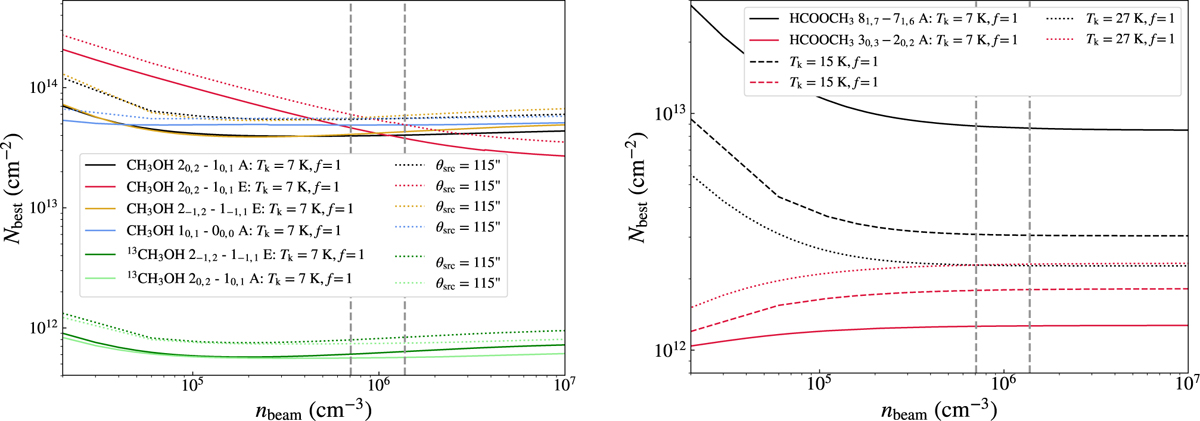
RADEX-calculated column density, Nbest, variation for different inputs of the beam-average volume density, nbeam. (left) Methanol (CH3OH and 13CH3OH) transitions are plotted in the case assuming a filling fraction of 1 (f = 1) or θsrc = 115″. (right) Methyl formate (HCOOCH3 A) transitions are plotted for different kinetic temperature, Tk, values. The vertical gray dashed lines show the range in beam-averaged volume densities used in our analysis.
Current usage metrics show cumulative count of Article Views (full-text article views including HTML views, PDF and ePub downloads, according to the available data) and Abstracts Views on Vision4Press platform.
Data correspond to usage on the plateform after 2015. The current usage metrics is available 48-96 hours after online publication and is updated daily on week days.
Initial download of the metrics may take a while.