Open Access
Fig. D.2
Download original image
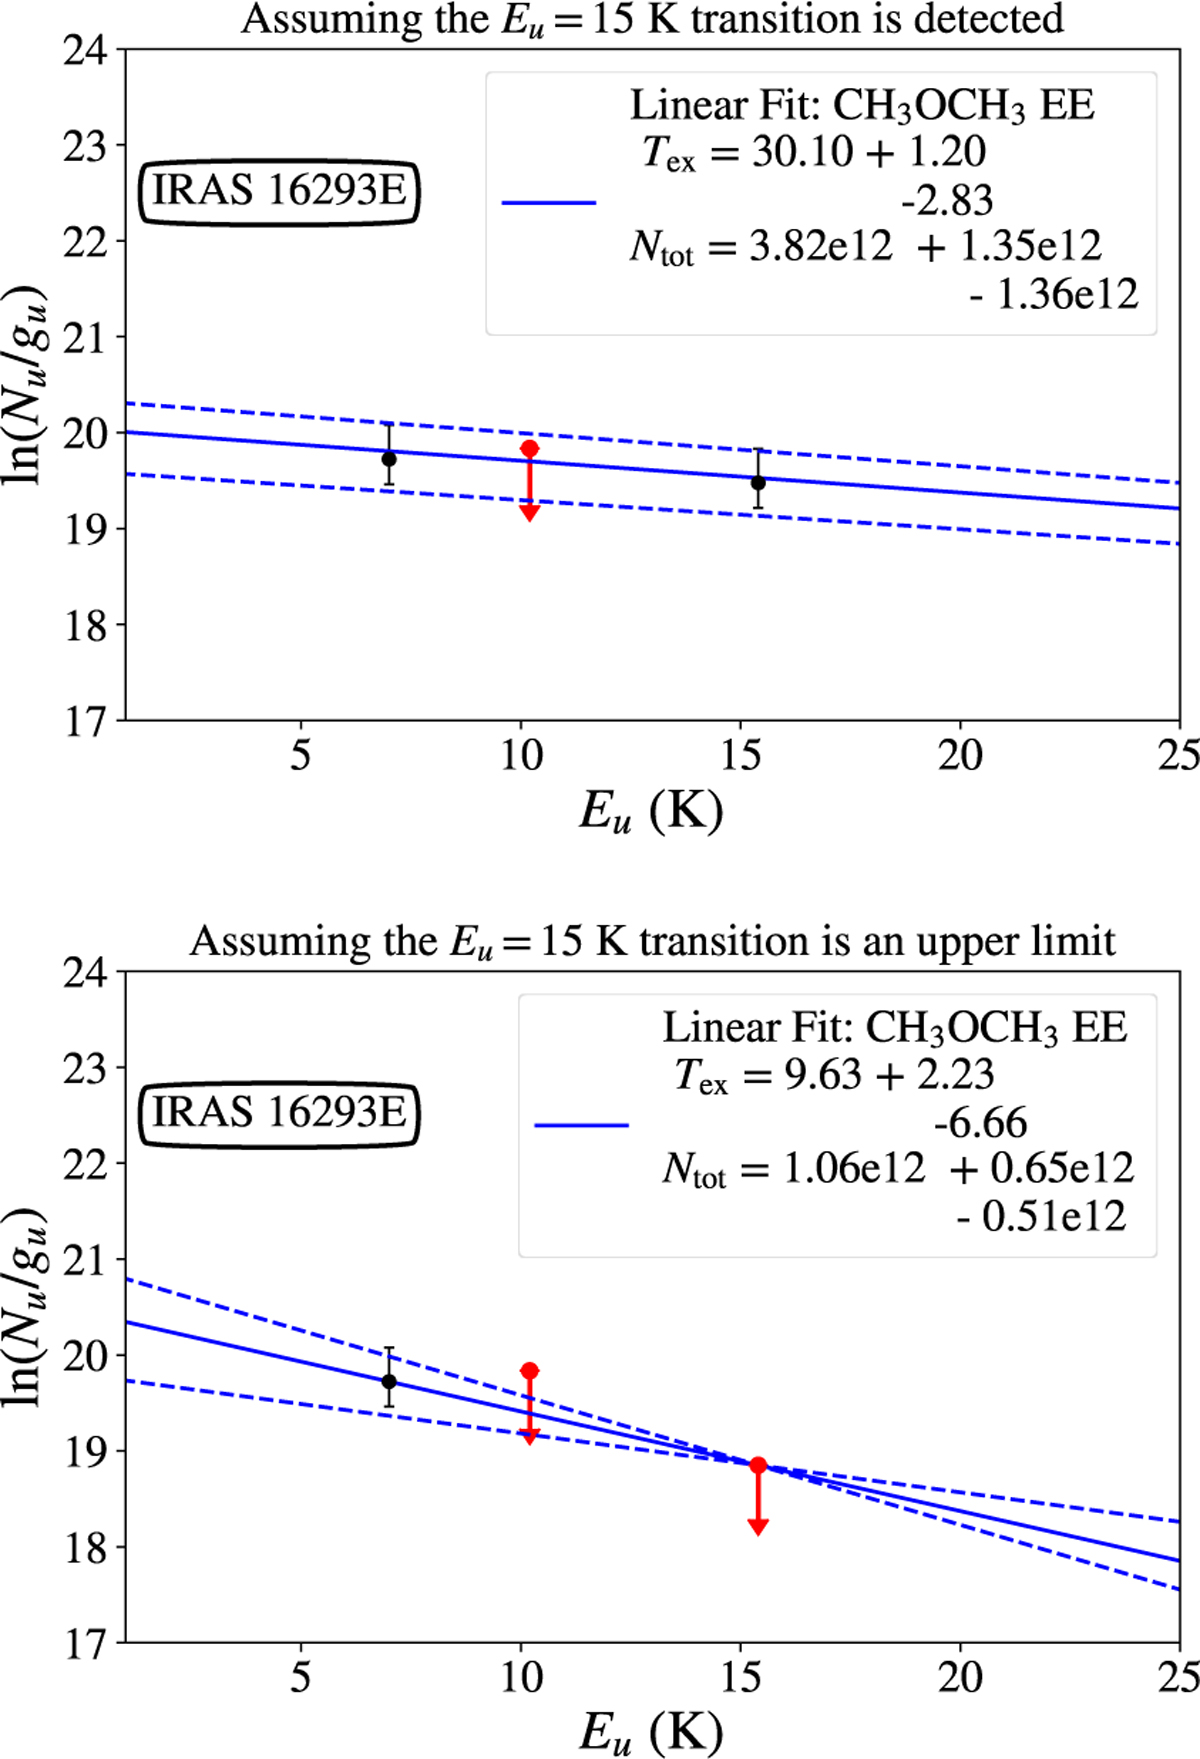
Rotation diagram with associated linear best-fits (solid curves) and corresponding uncertainty (dashed curves) for CH3OCH3 using the EE state transitions observed toward IRAS 16293E assuming either the 51,4 - 50,5 EE transition (Eu=15.4K) was a detection (top) or upper limit (bottom).
Current usage metrics show cumulative count of Article Views (full-text article views including HTML views, PDF and ePub downloads, according to the available data) and Abstracts Views on Vision4Press platform.
Data correspond to usage on the plateform after 2015. The current usage metrics is available 48-96 hours after online publication and is updated daily on week days.
Initial download of the metrics may take a while.