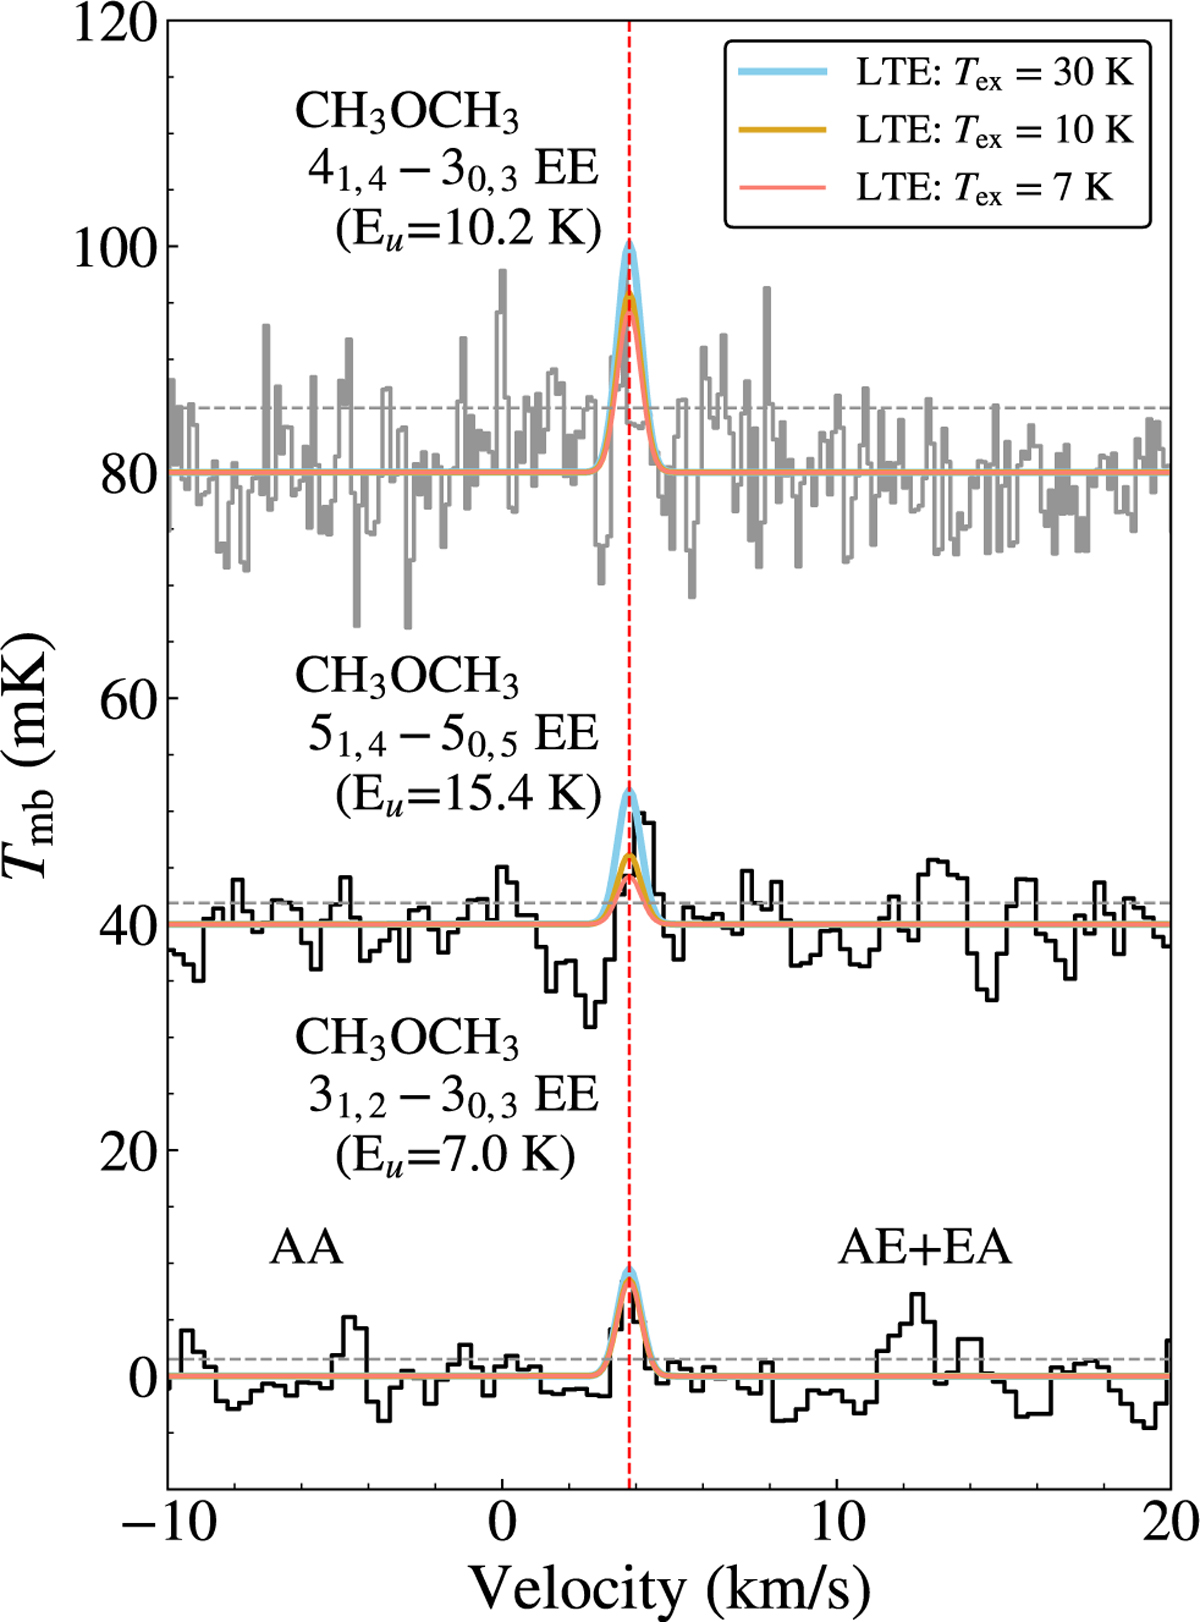
Fig. D.3
Download original image
Synthetic spectra fits to the CH3OCH3 EE lines from the ARO 12 m (top) and Yebes 40 m (middle and bottom). Note that the ARO 12 m transition (the 41,4−30,3 EE line) was not detected above 3σ and therefore only provides an upper limit. Spectra are offset by 40 mK for easier viewing. The vertical red line is centered at a vlsr of 3.8 km/s and the gray horizontal lines show the 1σ noise (RMS) level. Only for the 31,2 - 30,3 transition are the AA and AE+EA torsional states detected above the noise.
Current usage metrics show cumulative count of Article Views (full-text article views including HTML views, PDF and ePub downloads, according to the available data) and Abstracts Views on Vision4Press platform.
Data correspond to usage on the plateform after 2015. The current usage metrics is available 48-96 hours after online publication and is updated daily on week days.
Initial download of the metrics may take a while.