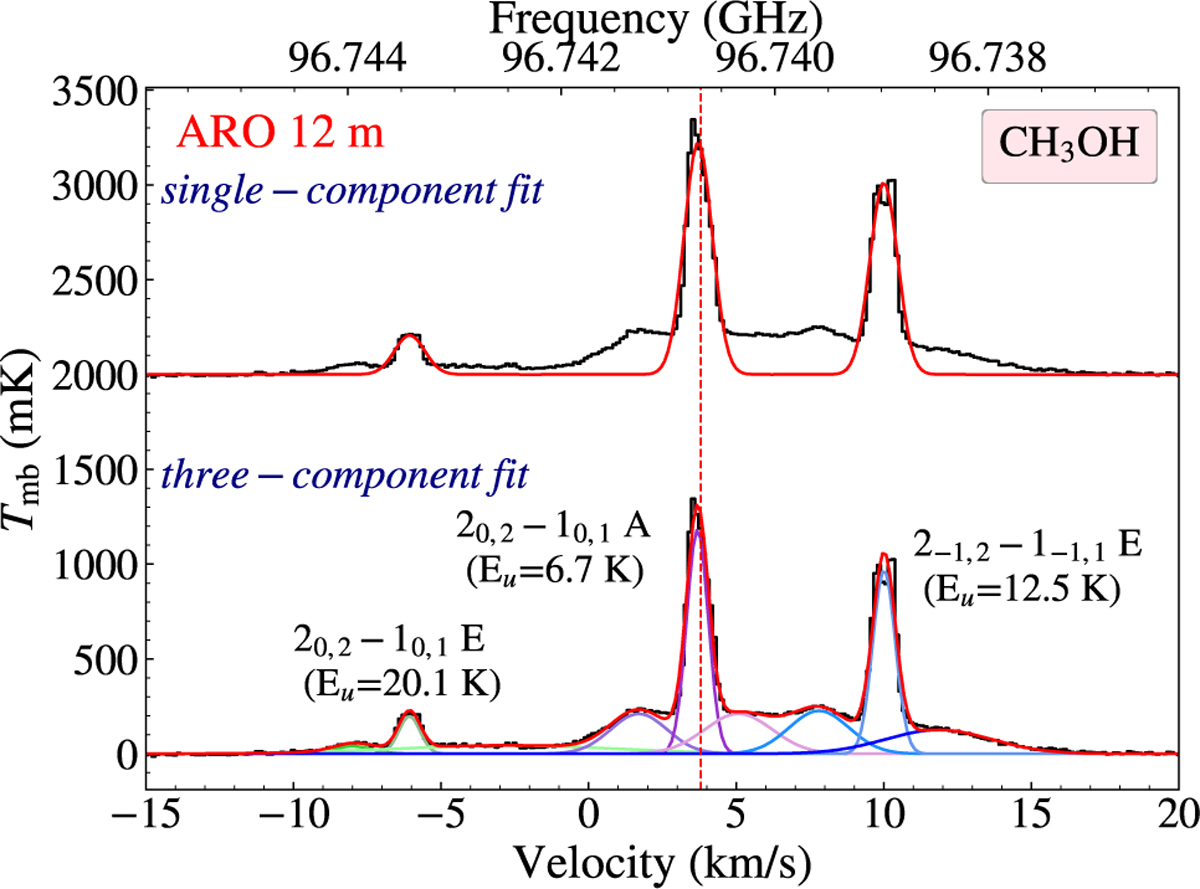
Fig. 2
Download original image
Observed CH3OH spectrum toward IRAS 16293E shown in black, and the Gaussian fit is shown as the red curve. The vertical red line at vlsr of 3.8 km/s is centered on the strongest line with the lowest Eu. (top) A single-component fit, as reported in Table 1, and (bottom) a three-velocity fit to each transition, separated out into the green, purple, and blue curves with a total red composite curve, reproduces the full profile better, but we note that the centrally peaked profile (i.e., at the vιsr of 3.8 km/s) from our single-component fit remains the most dominant profile.
Current usage metrics show cumulative count of Article Views (full-text article views including HTML views, PDF and ePub downloads, according to the available data) and Abstracts Views on Vision4Press platform.
Data correspond to usage on the plateform after 2015. The current usage metrics is available 48-96 hours after online publication and is updated daily on week days.
Initial download of the metrics may take a while.