Fig. 4
Download original image
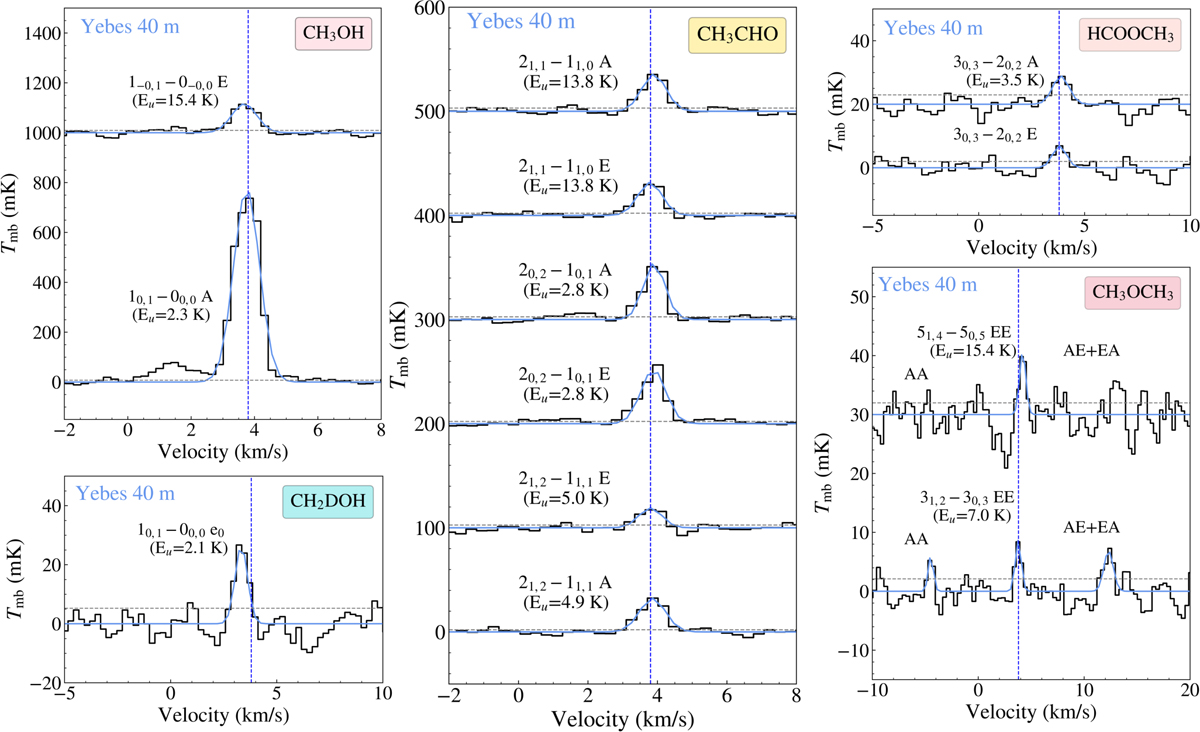
Observed Yebes 40 m spectra toward IRAS 16293E shown in black and Gaussian fits as blue curves. The vertical blue lines are centered at vlsr of 3.8 km/s, and the gray horizontal lines show the 1σ noise (RMS) level. From top left to bottom right: CH3OH spectra offset by 1000 mK, CH2DOH spectrum, CH3CHO spectra offset by 100 mK, HCOOCH3 spectra offset by 20 mK, and CH3OCH3 spectra offset by 30 mK.
Current usage metrics show cumulative count of Article Views (full-text article views including HTML views, PDF and ePub downloads, according to the available data) and Abstracts Views on Vision4Press platform.
Data correspond to usage on the plateform after 2015. The current usage metrics is available 48-96 hours after online publication and is updated daily on week days.
Initial download of the metrics may take a while.