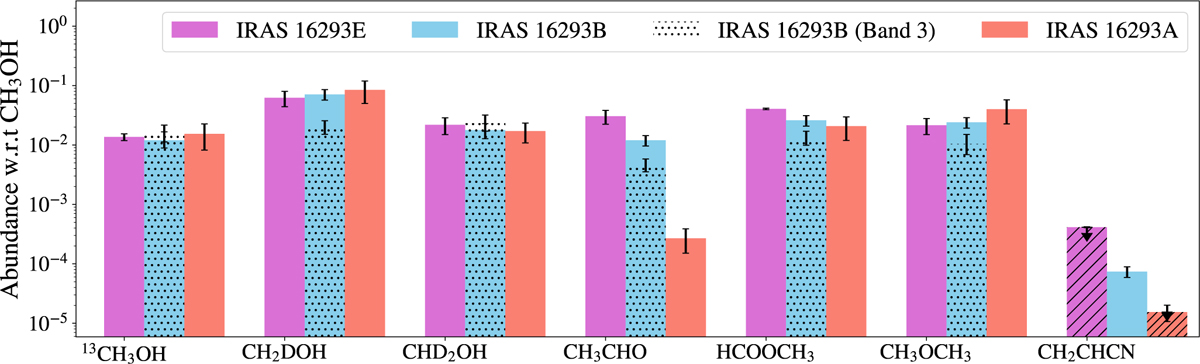
Fig. 6
Download original image
Comparison of D-COM and COM abundances normalized to methanol for IRAS 16293E and the nearby protostars A and B from ALMA Band 7 PILS data (Jørgensen et al. 2018; Calcutt et al. 2018; Manigand et al. 2020; Drozdovskaya et al. 2022), as well as from Nazari et al. (2024), who observed IRAS 16293B in ALMA Band 3 (overlaid dotted pattern). The upper limits for CH2CHCN are bins with downward arrows that have an overlaid hatching pattern (note: not shown is the IRAS 16293B Band 3 upper limit for CH2CHCN, which is <4.9 × 10⁻⁴). The methanol column density for IRAS 16293B (Band 7) stems from the analysis of the optically thin 18O-isotopologue of methanol and subsequent assumption of the canonical 16O/18O ISM ratio (Jørgensen et al. 2018), while that for IRAS 16293A is based on the analysis of selected optically thin lines of the main isotopologue itself (Manigand et al. 2020).
Current usage metrics show cumulative count of Article Views (full-text article views including HTML views, PDF and ePub downloads, according to the available data) and Abstracts Views on Vision4Press platform.
Data correspond to usage on the plateform after 2015. The current usage metrics is available 48-96 hours after online publication and is updated daily on week days.
Initial download of the metrics may take a while.